

Beginner Traders' Corner−−− USD/CAD
Basil Fayadh from eToro USA at 02/08/10
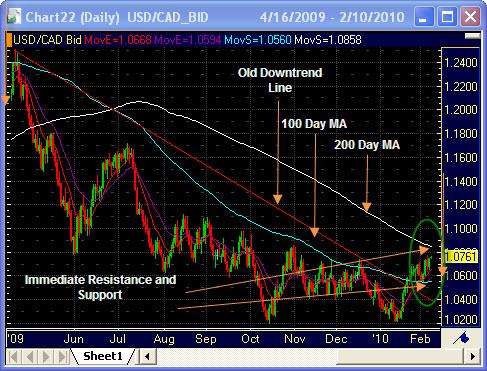
USD/CAD is trading right now around the 1.0750 level on the daily chart just between the 100 and 200 Day Moving Averages respectively. Look to these levels for immediate support and resistance on a daily basis and to give direction to the pair in the coming weeks. If you look at my earlier post you will notice that we examined this pair in January and were looking for a break of the 100 day moving average around 1.0550 (which it did) and also broke downtrend support, and the next resistance level was the 200 day moving average at 1.0858. Immediate support is now seen at the 100 day moving average around 1.0550 and down below to the old downtrend resistance line (now support) around 1.0450. A break to the topside could yield to1.1000, on to 1.1300 and upward to the 1.1600 area. Remember this is on a daily time-frame so you should always look at shorter time-frames as well depending on your strategy. This looks like a relatively quiet week both for USD and for CAD so keep your eye on Euro-zone news events to affect USD which will in turn affect the pair. Also, watch oil prices as there is a strong correlation to CAD and EUR as well.
Break- Term used to describe price moving higher through a resistance level or lower through a support level.
Moving Average-Moving averages measure the average price or exchange rate of a currency pair over a specific time frame.
Open- The initial price of a given security or commodity in a trading session. Also known as opening.
Resistance-The price level in which a currency pair has difficulty trading above. At resistance, price action tends to stall before breaking above, or reverse in the opposite direction.
Support-A price level in which a currency pair has difficulty falling below. At support, price action tends to stall before breaking below, or reverse in the opposite direction.
Trendline-A form of technical analysis formation created by drawing a line that connects a series of descending tops, descending bottoms, ascending tops or ascending bottoms.
Trendline-A form of technical analysis formation created by drawing a line that connects a series of descending tops, descending bottoms, ascending tops or ascending bottoms.
Technical Analysis-he art of forecasting price movements through the study of chart patterns, indicator signals, sentiment readings, volume and open interest.
Unlike fundamental analysis, technical analysis does not focus on economic data, but rather on interpretation of price data. One of the key tenets of technical analysis is that price patterns repeat themselves, allowing technical traders to make highly probabilistic bets on the direction of the instrument.
FX lends itself particularly well to technical analysis because it trades 24 hour per day and therefore provides a continuous stream of data that can be used for statistical analysis.
Calendar from forexfactory.com, glossary from FX Words, and charts powered by FX Solutions Accucharts
