

Chart of the Day – AUD/USD
James Chen from FX Solutions at 01/26/10
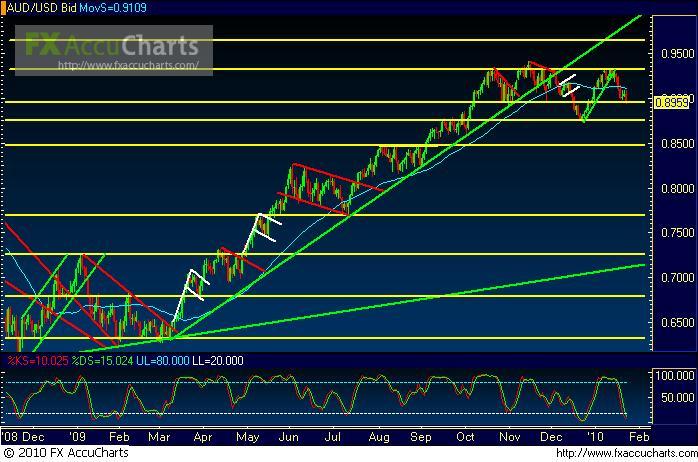
(Chart courtesy of FX Solutions' FX AccuCharts. Price on 1st pane, Slow Stochastics on 2nd pane; horizontal support/resistance levels in yellow; uptrend lines in green; downtrend lines in red; chart patterns in white; 50-period simple moving average in light blue.)
1/26/2010 – AUD/USD – Price action on AUD/USD, a daily chart of which is shown, has descended back down to hit key support around the 0.8950 price region before retreating back up. This occurs within the context of an overall sideways consolidation, after price reached strong resistance around 0.9325 in mid-January (just shy of the 15-month high around 0.9400 that was hit in mid-November 2009). Currently, U.S. dollar strength appears to be exerting some general downside pressure on this currency pair, pushing it towards a potential new downtrend, much like what currently appears to be occurring with EUR/USD. A strong breakdown and close below the noted 0.8950 support could target further key support around the last major low in the 0.8730 price region. Any further breakdown below that level should confirm a bearish continuation that could signal a new downtrend in the pair. Upside resistance within the current trading range consolidation continues to reside around the noted 0.9325 price region.
IMPORTANT NOTICE: These comments are for information purposes only. The information contained on this document does not constitute a solicitation to buy or sell by FX Solutions, LLC., and/or its affiliates, and is not to be available to individuals in a jurisdiction where such availability would be contrary to local regulation or law. Opinions, market data, and recommendations are subject to change at any time. Forex trading involves substantial risk of loss and is not suitable for all investors.
