

Chart of the Day – EUR/USD
James Chen from FX Solutions at 01/20/10
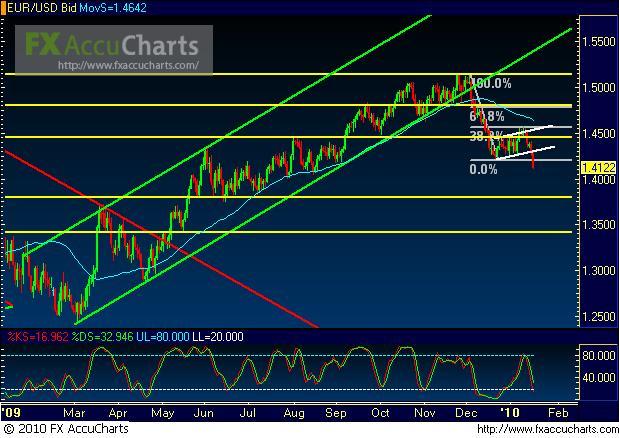
(Chart courtesy of FX Solutions' FX AccuCharts. Price on 1st pane, Slow Stochastics on 2nd pane; horizontal support/resistance levels in yellow; uptrend lines in green; downtrend lines in red; 50-period simple moving average in light blue.)
1/20/2010 – EUR/USD – Price action on EUR/USD, a daily chart of which is shown, has made a marked breakdown of a bearish continuation flag pattern that previously appeared to be on the verge of becoming invalidated. After the false upside tests of last week (which reached up to the key 38.2% Fibonacci retracement level of the initial downtrend run), price dropped substantially to break the flag to the downside, fulfilling the pattern’s customary role as a trend continuation formation. With the consolidation finally broken, the current directional bias is towards a continuation of the new downtrend, which could target further downside support in the 1.3800 price region. Upside resistance within the context of the continuing bearish trend resides in the 1.4450 support/resistance price region.
* Visit my forex tips and techniques blog here: http://fxpath.fxstreet.com *
IMPORTANT NOTICE: These comments are for information purposes only. The information contained on this document does not constitute a solicitation to buy or sell by FX Solutions, LLC., and/or its affiliates, and is not to be available to individuals in a jurisdiction where such availability would be contrary to local regulation or law. Opinions, market data, and recommendations are subject to change at any time. Forex trading involves substantial risk of loss and is not suitable for all investors.
