

Chart of the Day – EUR/USD
James Chen from FX Solutions at 12/01/09
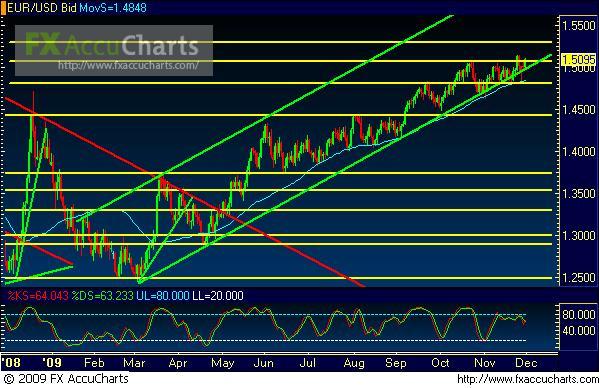
(Chart courtesy of FX Solutions' FX AccuCharts. Price on 1st pane, Slow Stochastics on 2nd pane; horizontal support/resistance levels in yellow; uptrend lines in green; downtrend lines in red; 50-period simple moving average in light blue.)
12/01/2009 – EUR/USD – Although recent price action in the last few weeks has threatened on numerous occasions to break the longstanding uptrend in EUR/USD (a daily chart of which is shown), this currency pair continues to salvage the trend by recovering at the last moment with short bursts of bullishness. The current uptrend has been in place since the March lows, and price just hit a new 15-month high last week before reverting back to the area of the uptrend support line (and the 50-day moving average, which has served well as uptrend support for several months now). Currently, price has just made yet another bullish turn-up around the trendline (and moving average), and could now be targeting a re-test and potential breakout above the noted 15-month high (around 1.5143). Any strong breakout above this long-term high should target further upside resistance in the 1.5300 price region. To the downside, a potential trend change should be evident on a breakdown and close below the 1.4800 support/resistance region.
* Visit my forex tips and techniques blog here: http://fxpath.fxstreet.com *
IMPORTANT NOTICE: These comments are for information purposes only. The information contained on this document does not constitute a solicitation to buy or sell by FX Solutions, LLC., and/or its affiliates, and is not to be available to individuals in a jurisdiction where such availability would be contrary to local regulation or law. Opinions, market data, and recommendations are subject to change at any time. Forex trading involves substantial risk of loss and is not suitable for all investors.
