

Chart of the Day – USD/CHF
James Chen from FX Solutions at 01/08/10
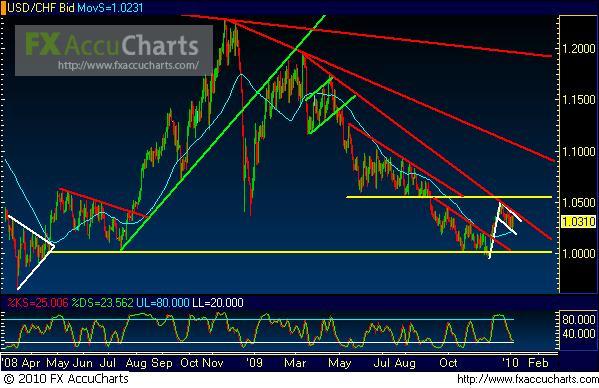
(Chart courtesy of FX Solutions' FX AccuCharts. Price on 1st pane, Slow Stochastics on 2nd pane; horizontal support/resistance levels in yellow; uptrend lines in green; downtrend lines in red; chart patterns in white; 50-period simple moving average in light blue.)
1/08/2010 – USD/CHF – Price action on USD/CHF (a daily chart of which is shown) has, much like its EUR/USD counterpart, formed a solid flag pattern. In the case of USD/CHF, this potentially bullish flag formation occurs after a tentative bottom was established just below parity. The top of this flag conforms approximately to a downtrend resistance line extending from the March 2009 high. If the flag fulfills itself as a continuation pattern with an upside breakout, which would coincide with an upside breakout above the noted downtrend resistance line, an immediate upside resistance target resides in the 1.0550 price region. To the downside, if the downtrend resistance line and top border of the flag are ultimately respected, this currency pair could potentially target a re-test of parity and possibly go on to continue the long-term downtrend.
* Visit my forex tips and techniques blog here: http://fxpath.fxstreet.com *
IMPORTANT NOTICE: These comments are for information purposes only. The information contained on this document does not constitute a solicitation to buy or sell by FX Solutions, LLC., and/or its affiliates, and is not to be available to individuals in a jurisdiction where such availability would be contrary to local regulation or law. Opinions, market data, and recommendations are subject to change at any time. Forex trading involves substantial risk of loss and is not suitable for all investors.
