

Chart of the Day – USD/JPY
James Chen from FX Solutions at 11/24/09
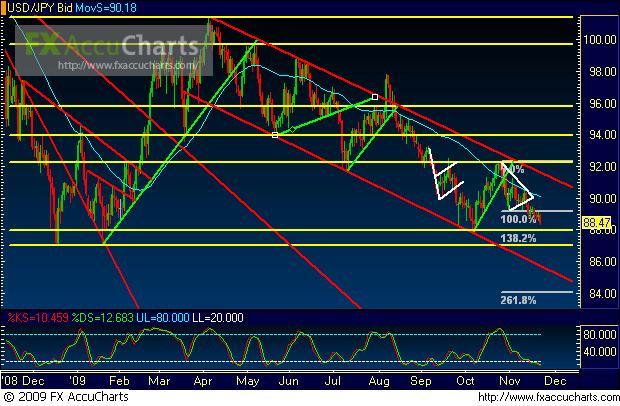
11/24/2009 – USD/JPY – Bearish price action on USD/JPY, a daily chart of which is shown, has just made a new 6-week low and is currently targeting a re-test of the key 88.00 support level, which was last hit in early October. This occurs after price broke down below a triangle consolidation pattern in mid-November. Overall, this currency pair is firmly entrenched within a parallel downtrend channel extending from the April high at 101.43, and the general bias within this channel continues to be bearish. Any breakdown below the strong support at 88.00 should easily shoot for an immediate further support target in the 87.00 price region, which represents key support from the long-term double-bottom low that occurred in the beginning of the year. On a longer-term basis, with continued bearishness in the pair, a potential downside target resides in the 84.00 price region.
* Visit my forex tips and techniques blog here: http://fxpath.fxstreet.com *
IMPORTANT NOTICE: These comments are for information purposes only. The information contained on this document does not constitute a solicitation to buy or sell by FX Solutions, LLC., and/or its affiliates, and is not to be available to individuals in a jurisdiction where such availability would be contrary to local regulation or law. Opinions, market data, and recommendations are subject to change at any time. Forex trading involves substantial risk of loss and is not suitable for all investors.
