

Chart of the Day – USD/JPY
James Chen from FX Solutions at 12/07/09
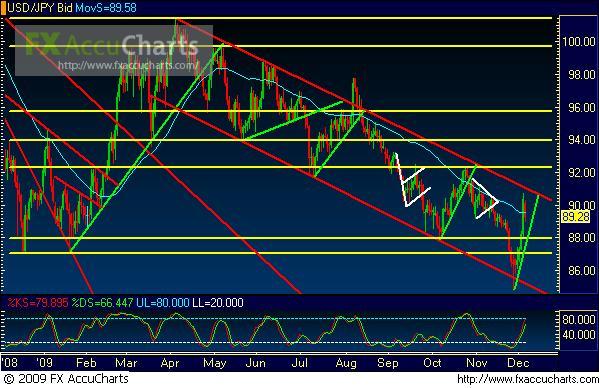
(Chart courtesy of FX Solutions' FX AccuCharts. Price on 1st pane, Slow Stochastics on 2nd pane; horizontal support/resistance levels in yellow; uptrend lines in green; downtrend lines in red; 50-period simple moving average in light blue.)
12/07/2009 – USD/JPY – Price action to begin the new week on USD/JPY (a daily chart of which is shown), after the marked bullishness that dominated on this pair last week, has respected a key downtrend resistance line (within a parallel downtrend channel) extending from the April high. Monday’s price action retreated from this downtrend resistance after hitting a 4-week high on Friday. Continued bearishness coming off that high should continue the prevailing downtrend in the pair, targeting support around 88.00 once again, with further support around the 87.00 price region. A breakdown below the current intra-channel uptrend support line should signal this further bearishness. To the upside, the noted downtrend resistance line should continue, at least in the near-term, to serve as dynamic resistance going forward.
* Visit my forex tips and techniques blog here: http://fxpath.fxstreet.com *
IMPORTANT NOTICE: These comments are for information purposes only. The information contained on this document does not constitute a solicitation to buy or sell by FX Solutions, LLC., and/or its affiliates, and is not to be available to individuals in a jurisdiction where such availability would be contrary to local regulation or law. Opinions, market data, and recommendations are subject to change at any time. Forex trading involves substantial risk of loss and is not suitable for all investors.
