

Chart of the Day – USD/CAD
James Chen from FX Solutions at 01/15/10
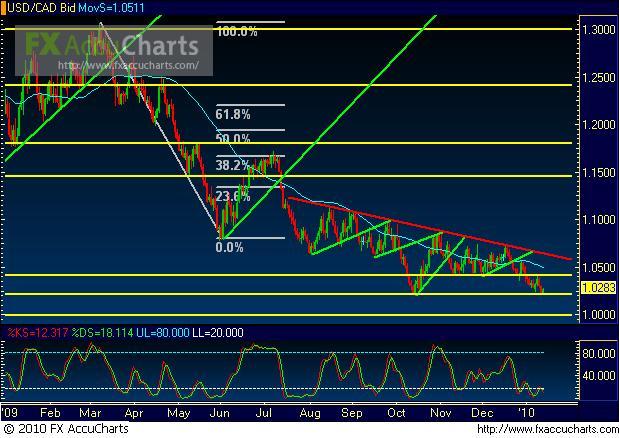
(Chart courtesy of FX Solutions' FX AccuCharts. Price on 1st pane, Slow Stochastics on 2nd pane; horizontal support/resistance levels in yellow; uptrend lines in green; downtrend lines in red; 50-period simple moving average in light blue.)
1/15/2010 – USD/CAD – Price action on USD/CAD, a daily chart of which is shown, has approached a strong support area in the 1.0200 price region, which represents the long-term 14-month low hit in October 2009. This approach of key support occurs within the context of an overall downtrend in the pair. As of early Friday (1/15/2010) New York session, price has tentatively made a bounce up off this support. Significant upside resistance for this bounce resides around the strong support/resistance area just above the 1.0400 region. On any substantial breakdown below the noted 1.0200 support, a 17-month low will have been established, with the key downside support target residing around parity in the 1.0000 price region.
* Visit my forex tips and techniques blog here: http://fxpath.fxstreet.com *
IMPORTANT NOTICE: These comments are for information purposes only. The information contained on this document does not constitute a solicitation to buy or sell by FX Solutions, LLC., and/or its affiliates, and is not to be available to individuals in a jurisdiction where such availability would be contrary to local regulation or law. Opinions, market data, and recommendations are subject to change at any time. Forex trading involves substantial risk of loss and is not suitable for all investors.
