

Chart of the Day – GOLD
James Chen from FX Solutions at 01/18/10
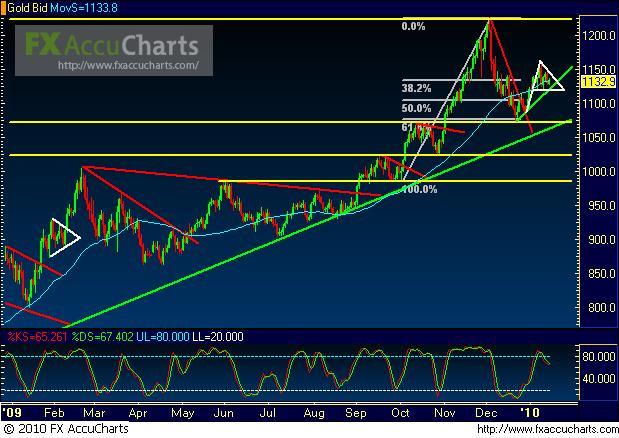
(Chart courtesy of FX Solutions' FX AccuCharts. Price on 1st pane, Slow Stochastics on 2nd pane; horizontal support/resistance levels in yellow; uptrend lines in green; downtrend lines in red; chart patterns in white; 50-period simple moving average in light blue.)
1/18/2010 – GOLD – Price action on spot gold, a daily chart of which is shown, has formed a potentially bullish pennant consolidation pattern within the context of its rebound off December lows. This rebound is represented by a short-term uptrend support line extending from the December 22 support low around 1074. This all occurs within the context of an overall, continuing uptrend. Any significant breakout above the pennant consolidation could signify a potential recovery in gold and an uptrend continuation that could ultimately target further resistance around the 1225 all-time high. Any significant breakdown below both the noted short-term uptrend support line and the pennant pattern could target downside support in the noted 1070-74 support/resistance price region. Any substantial breakdown below that support level could place the current long-term uptrend in jeopardy.
* Visit my forex tips and techniques blog here: http://fxpath.fxstreet.com *
IMPORTANT NOTICE: These comments are for information purposes only. The information contained on this document does not constitute a solicitation to buy or sell by FX Solutions, LLC., and/or its affiliates, and is not to be available to individuals in a jurisdiction where such availability would be contrary to local regulation or law. Opinions, market data, and recommendations are subject to change at any time. Forex trading involves substantial risk of loss and is not suitable for all investors.
