

Chart of the Day – USD/CHF
James Chen from FX Solutions at 10/26/09
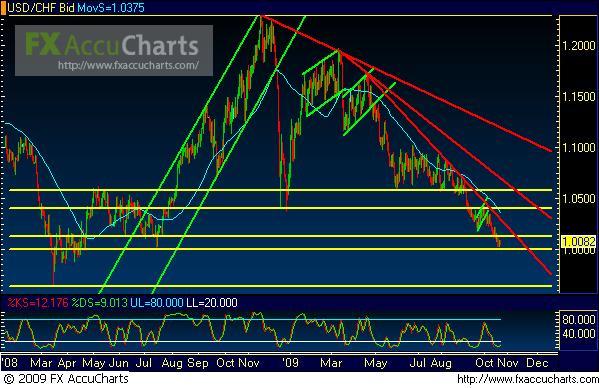
(Chart courtesy of FX Solutions' FX AccuCharts. Price on 1st pane, Slow Stochastics on 2nd pane; horizontal support/resistance levels in yellow; uptrend lines in green; downtrend lines in red; 50-period simple moving average in light blue.)
10/26/2009 – USD/CHF – Bearish price action on USD/CHF, a daily chart of which is shown, is approaching parity within the context of a steep, continuing downtrend. Parity (at 1 U.S. dollar to 1 Swiss franc) was last hit in July of 2008. Therefore, the long-term low from last week, which fell just shy of reaching parity, represented a 15-month low for the pair. Currently, the key near-term level to watch, as mentioned, is parity at 1.0000. But even if this is reached, there is likely further room to the downside for this pair potentially to fall. On any strong breakdown below parity, the major further support target to the downside resides around 0.9640, the all-time low for the pair that was reached in March 2008. Within the context of the strong current downtrend, dynamic upside resistance resides in the region of the downtrend resistance line that extends from the April high.
James Chen, CMT
Chief Technical Strategist
FX Solutions
IMPORTANT NOTICE: These comments are for information purposes only. The information contained on this document does not constitute a solicitation to buy or sell by FX Solutions, LLC., and/or its affiliates, and is not to be available to individuals in a jurisdiction where such availability would be contrary to local regulation or law. Opinions, market data, and recommendations are subject to change at any time. Forex trading involves substantial risk of loss and is not suitable for all investors.
