

Chart of the Day – Silver
James Chen from FX Solutions at 12/16/09
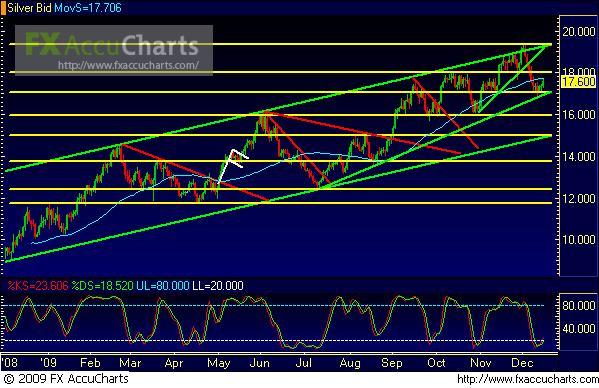
(Chart courtesy of FX Solutions' FX AccuCharts. Price on 1st pane, Slow Stochastics on 2nd pane; horizontal support/resistance levels in yellow; uptrend lines in green; downtrend lines in red; 50-period simple moving average in light blue.)
12/16/2009 – Silver – Price action on spot silver, a daily chart of which is shown, has made a tentative rebound off support around the 17 price region. This occurs on the heels of price falling precipitously after reaching a long-term high around the 19.40 extreme. That high represented the top of a long-term parallel uptrend channel. The fall that occurred after that high was reached was both swift and steep, and ended in a short consolidation before making a turn back up as of Wednesday (12/16/2009). This turn is confirmed by oscillators like the displayed Stochastics, which are indicating a potential emergence up from oversold. To the upside, the next key resistance area resides around the 18 price region, a strong breakout above which price could target a re-test of the top of the noted parallel uptrend channel as well as the aforementioned long-term price high. Downside support within the context of the current bullish turn continues to reside around the 17 price region.
* Visit my forex tips and techniques blog here: http://fxpath.fxstreet.com *
IMPORTANT NOTICE: These comments are for information purposes only. The information contained on this document does not constitute a solicitation to buy or sell by FX Solutions, LLC., and/or its affiliates, and is not to be available to individuals in a jurisdiction where such availability would be contrary to local regulation or law. Opinions, market data, and recommendations are subject to change at any time. Forex trading involves substantial risk of loss and is not suitable for all investors.
