

Chart of the Day – EUR/JPY
James Chen from FX Solutions at 11/19/09
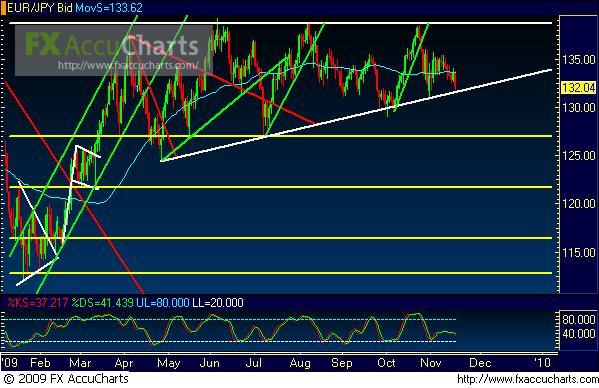
11/19/2009 – EUR/JPY – Price action on EUR/JPY, a daily chart of which is shown, is displaying dramatic yen strengthening today on stock market declines that is also abundantly clear on other major yen pairs/crosses like USD/JPY and GBP/JPY. In the case of EUR/JPY, price has descended all the way down to approach a dynamically-ascending support line extending from the April low. This support line constitutes the bottom border of a large, prolonged ascending triangle pattern (horizontal top and ascending bottom). Therefore, bearish price action is currently threatening a potential breakdown of this triangle consolidation. In the event of a significant breakdown, a major downside support target to watch for resides in the 127.00 price region.
* Visit my forex tips and techniques blog here: http://fxpath.fxstreet.com *
IMPORTANT NOTICE: These comments are for information purposes only. The information contained on this document does not constitute a solicitation to buy or sell by FX Solutions, LLC., and/or its affiliates, and is not to be available to individuals in a jurisdiction where such availability would be contrary to local regulation or law. Opinions, market data, and recommendations are subject to change at any time. Forex trading involves substantial risk of loss and is not suitable for all investors.
