

Chart of the Day – SILVER
James Chen from FX Solutions at 01/25/10
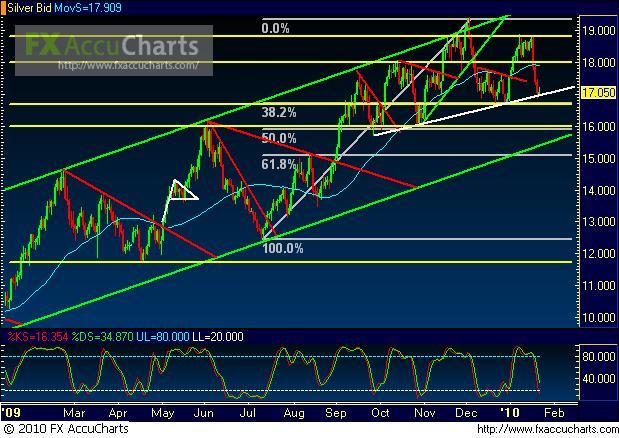
(Chart courtesy of FX Solutions' FX AccuCharts. Price on 1st pane, Slow Stochastics on 2nd pane; horizontal support/resistance levels in yellow; uptrend lines in green; downtrend lines in red; chart patterns in white; 50-period simple moving average in light blue.)
1/25/2010 – SILVER – Price action on spot silver, a daily chart of which is shown, took a steep dive for most of last week after reaching resistance around the 18.80 price region. Price at that level approached, but fell short of, the 19.40 region long-term high that was reached in early December 2009. Currently, the price decline of last week has brought silver down to approach key support in the 16.70 price region. In the process, it has also formed the rough pattern of a head-and-shoulders formation, with price currently around the region of the neckline. Any substantial breakdown below both this neckline and the noted 16.70 support region could indicate further bearishness going forward. In this event, an immediate support level to the downside resides around the 16.00 price region, with additional dynamic support residing around the bottom border of the long-term parallel uptrend channel. To the upside, a pronounced bounce up off the current support should target resistance around the 18.00 price region.
* Visit my forex tips and techniques blog here: http://fxpath.fxstreet.com *
IMPORTANT NOTICE: These comments are for information purposes only. The information contained on this document does not constitute a solicitation to buy or sell by FX Solutions, LLC., and/or its affiliates, and is not to be available to individuals in a jurisdiction where such availability would be contrary to local regulation or law. Opinions, market data, and recommendations are subject to change at any time. Forex trading involves substantial risk of loss and is not suitable for all investors.
