

Chart of the Day – Silver
James Chen from FX Solutions at 02/01/10
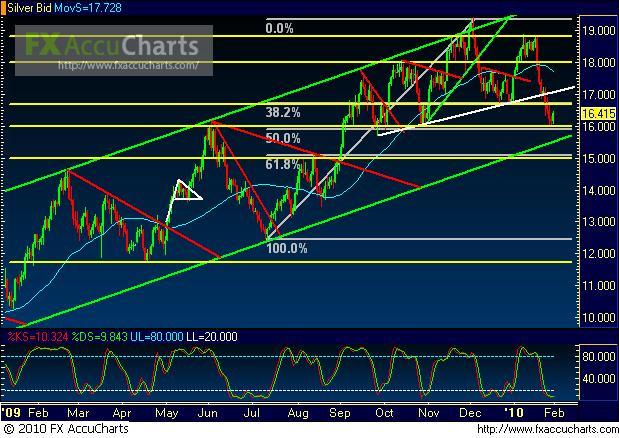
(Chart courtesy of FX Solutions' FX AccuCharts. Price on 1st pane, Slow Stochastics on 2nd pane; horizontal support/resistance levels in yellow; uptrend lines in green; downtrend lines in red; chart patterns in white; 50-period simple moving average in light blue.)
2/01/2010 – Silver – Price action last week on spot silver, a daily chart of which is shown, broke down below a rough head & shoulders pattern neckline as well as key support in the 16.70 price region. At the end of last week, price had reached the noted downside support target of 16.00, approaching the bottom support border of a key parallel uptrend channel. With a good bounce to begin this new week, silver has tentatively respected the 16.00 support level. Short-term upside resistance on this bounce tentatively resides, once again, in the 16.70 price region. However, the bearishness of the past couple of weeks in the spot metals may not be over just yet. In the event of a subsequent breakdown below the noted 16.00 support level, immediate dynamic support to the downside resides around the noted bottom border of the overall parallel uptrend channel. Any further breakdown below that bottom support border would place the current uptrend in jeopardy, with a further downside support target in the immediate 15.00 price region.
IMPORTANT NOTICE: These comments are for information purposes only. The information contained on this document does not constitute a solicitation to buy or sell by FX Solutions, LLC., and/or its affiliates, and is not to be available to individuals in a jurisdiction where such availability would be contrary to local regulation or law. Opinions, market data, and recommendations are subject to change at any time. Forex trading involves substantial risk of loss and is not suitable for all investors.
