

Chart of the Day – Silver
James Chen from FX Solutions at 11/23/09
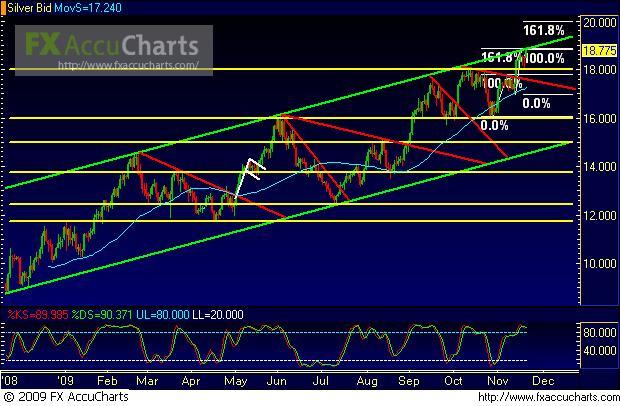
11/23/2009 – Silver – Price action on spot silver, a daily chart of which is shown, has reached the very top of a key parallel uptrend channel, in the process hitting a new long-term high (just short of $19). This high at the top of the parallel uptrend channel also coincides with a 161.8% Fibonacci extension of the bullish run from $16.06 to $17.73 early this month. The current bullishness in silver mirrors the phenomenal run that has occurred in gold, as the latter hits progressively higher all-time highs. At the current juncture, a potential impending correction could be due both in silver and gold, with downside support in silver residing around the $18 price region. A clear upside resistance target in the event of further bullishness – as forecasted by the 161.8% Fibonacci extension of the most recent bullish run (from $16.99 to $18.79) – resides around the $20 price region.
* Visit my forex tips and techniques blog here: http://fxpath.fxstreet.com *
IMPORTANT NOTICE: These comments are for information purposes only. The information contained on this document does not constitute a solicitation to buy or sell by FX Solutions, LLC., and/or its affiliates, and is not to be available to individuals in a jurisdiction where such availability would be contrary to local regulation or law. Opinions, market data, and recommendations are subject to change at any time. Forex trading involves substantial risk of loss and is not suitable for all investors.
