

Comprehensive FX and Futures Daily Commentary
FastBrokers Research Team from FastBrokersFX at 01/04/10
Daily Market Commentary
EUR/USD Climbs with Broad Dollar Weakness
The EUR/USD has popped off our 2nd tier uptrend line and is trying to set a bottom above December lows as the Dollar experiences broad-based weakness. Equity markets are looking up for the first trading session of 2010 and investors are favoring the risk trade after encouraging economic data from Britain. The improvement in Britain’s Manufacturing PMI and Net Lending to Individuals yielded a pop in both the Cable and the EUR/USD with investors regaining confidence in the global economic recovery. The U.S. has ISM Manufacturing PMI data on deck, which could also prove to be a market mover. Speaking of Manufacturing PMI, China’s beat analyst estimates on January 1st, showing the recovery in the world’s 3rd largest economy has not slowed. Although investors will receive another wave of data tomorrow, including the EU’s CPI Flash Estimate, more attention will likely be paid to America’s ADP Non-Farm Employment Change. Most of the excitement in the Dollar can be attributed to America’s turnaround in employment data. Hence, investors will likely focus in on Wednesday’s ADP release.
Technically speaking, the EUR/USD still faces multiple downtrend lines along with the psychological 1.45 level, 12/29, 12/23, and 12/18 highs. Hence, some challenging near-term topside technicals are in place due to the EUR/USD’s December downturn. As for the downside, the EUR/USD has technical cushions in the form of our 1st (off chart) and 2nd tier uptrend lines along with intraday and 12/22 lows. However, the EUR/USD is still trading well below our 3rd tier uptrend line that runs through July lows, meaning the currency pair could be in for more losses over the medium-term towards the psychological 1.40 area should economic data outside of the U.S. continue to recover.
Present Price: 1.4392
Resistances: 1.4401, 1.4430, 1.4454, 1.4478, 1.4509, 1.4540
Supports: 1.4371, 1.4348, 1.4323, 1.4303, 1.4272, 1.42464187
Psychological: 1.45, 1.40, December and September Lows 
GBP/USD Trades Higher after Encouraging Data Set
The Cable has recovered nicely from December lows and strengthened earlier today following an encouraging data set. Britain’s Manufacturing PMI, Net Lending to Individuals, and Mortgages Approvals data all printed stronger than expected, an encouraging sign for the Pound ahead of Thursday’s BoE monetary policy meeting. However, at its previous meeting the BoE did imply that it would likely take a wait-and-see approach in regards to inflation before deciding whether to take action monetarily. Therefore, should the rest of this week’s UK economic data print positively the BoE would be encouraged to keep its monetary policy unchanged before February’s meeting. Speaking of economic data, tomorrow the UK will release its Halifax HPI figure followed by Services PMI data on Wednesday. The Services PMI number should garner additional attention since the services industry comprises a majority of the UK’s GDP. Meanwhile, investors will be eyeing America’s ISM Manufacturing PMI report coming later today. A stronger than expected U.S. Manufacturing PMI number could take a bite out of the Cable’s intraday gains as investors favor the Dollar again. However, weak U.S. data would be another reason for investors to snap up the Cable and could lead to a test of 12/11/09 highs.
Technically speaking, the Cables pop back above its psychological 1.60 level is an encouraging sign considering the extent of December’s pullback. That being said, the Cable does have a downward force at play until the currency pair can overcome a few more topside barriers. The Cable faces multiple downtrend lines along 12/11, 12/16, and 12/7 highs. Furthermore, the psychological 1.65 level could serve as a topside obstacles should it be tested. As for the downside, the Cable now has multiple uptrend lines serving as technical cushions along with intraday, 12/23, and 12/30 lows. Additionally, the psychological 1.60 level could serve as a sturdy support should it be tested.
Present Price: 1.6155
Resistances: 1.6164, 1.6185, 1.6204, 1.6240, 1.6266, 1.6289
Supports: 1.6134, 1.6105, 1.6075, 1.6050, 1.6024, 1.5976
Psychological: 1.60, December highs and lows 
USD/JPY Weakens Slight as Gold Gains and Dollar Weakens
The USD/JPY is trading off December highs as the Dollar weakens across the board and gold bounces back above $1100/oz. Hence, investors are showing a preference for the risk trading today following a positive set of economic data from the UK. Furthermore, the Development Bank of Japan announced it is extending a $2.2 billion credit line to Japan Airlines, thwarting fears of bankruptcy which sent the Yen tumbling last week. Meanwhile, investors are looking on to today’s U.S. ISM Manufacturing PMI figure. Investors may be encouraged to buy up the USD/JPY again should America’s economic data outperform, while weakness in the U.S. economy could send investors back to the Yen for some safety. However, investors are likely focusing in on Wednesday’s U.S. Non-Farm Employment Change number. The recovery in U.S. employment data triggered the Dollar’s run during December. Therefore, this week’s employment data could carry some additional weight. Japan will be quiet on the data-front this week, leaving its movements up to momentum and correlation. Hence, we’ll monitor how the Yen behaves with the Dollar’s broad-based reaction to upcoming data releases.
Technically speaking, the USD/JPY overcame some notable topside barriers during the month of December, most notably the psychological 90 level and a few heavily-weighted downtrend lines. Speaking of downtrend lines, our 2nd tier downtrend line could prove to be a key barrier since it runs through August ’09 highs. Hence, an eclipse of our 2nd tier could potentially yield a medium-term run towards the 97.50 area. Meanwhile, the USD/JPY does face multiple downtrend lines along with September highs and the psychological 95 zone. As for the downside, the USD/JPY has multiple uptrend lines serving as technical cushions along with 12/31 and 12/24 lows. Furthermore, the psychological 90 area could serve as a suitable cushion should it be tested.
Present Price: 92.83
Resistances: 92.95, 93.14, 93.30, 93.59, 93.85, 94.02
Supports: 92.61, 92.23, 91.95, 91.78, 91.57, 91.37
Psychological: 95, 90, September Highs 
Gold Pops Back Above $1100/oz
Gold is logging solid gains today as we witness broad based Dollar weakness in the FX markets today. Dollar weakness is an ideal environment for gold bulls since the precious metal has proven to be negatively correlated against the Greenback as investors head towards the risk trade. Meanwhile, investors are waiting for America’s ISM Manufacturing PMI number coming in about an hour’s time. It will be interesting to monitor the Dollar’s reaction to today’s U.S. release since investors were buying up the Greenback on positive data during the month of December. Hence, a strong Manufacturing PMI figure could temper gold’s present upward momentum. Despite today’s data release, investors are likely honing in on Wednesday’s U.S. Non-Farm Employment Change number. December’s Dollar rally was triggered by a turnaround in U.S. employment data. Therefore, Wednesday’s release could really move gold and the Dollar should the figure surprise in either direction.
Technically speaking, gold has multiple uptrend lines serving as technical cushions along with 12/31, 12/30 and 12/22 lows. On an encouraging note, gold has set consecutive higher lows after bottoming out in December and we are unable to form a noteworthy downtrend line. Therefore, gold could have some decent upward mobility should the Dollar continue to weaken. Meanwhile, our 4th tier uptrend line could prove to be an important trend line since it runs through 10/28 lows, or the $1025/oz level. As for the topside, gold faces technical barriers in the form of 12/17 highs along with the psychological $1150/oz level.
Present Price: $1117.55/oz
Resistances: $1117.80/oz, $1122.70/oz, $1128.09/oz, $1132.99/oz, $1137.41/oz, $1141.33/oz
Supports: $1110.94/oz, $1104.83/oz, $1100.55/oz, $1096.27/oz, $1092.91/oz
Psychological: $1100/oz, $1150/oz, December lows 
Crude Futures Trade above $80/bbl on Cold Front
Crude futures have made an aggressive move above our 3rd tier downtrend line and the psychological $80/bbl as investors react to multiple developments. First and foremost, a record-setting cold front is hitting the U.S., increasing demand for heating oil in the North East. Additionally, China’s encouraging Manufacturing PMI along with today’s upbeat UK economic data has investors optimistic about the prospects of the global economy as 2010 kicks off. The U.S. will release its own Manufacturing PMI figure later as well. An improvement in manufacturing implies an increase in demand for and consumption of energy, a positive development for the price of crude. Furthermore, last week’s political tensions in Iran coupled with a trade dispute between Russia and the EU are serving as positive psychological catalysts for crude futures. Meanwhile, investors should keep an eye on activity in the FX markets. Additional weakness in the Dollar and strength in gold could benefit crude futures due to correlative forces.
Technically speaking, crude’s movement above our 3rd tier downtrend line could be a key development since our 3rd tier runs through November ’09 highs. Hence, crude could be in for a retest of 2009 highs in the near-future. That being said, the psychological $80/bbl area has proven to be a tricky trading zone in the past. Therefore, crude may need more positive fundamental developments to send the future beyond 2009 levels. As for the downside, crude has multiple uptrend lines serving as technical cushions along with 12/29 and 12/24 lows. Additionally, the psychological $80/bbl level may now serve as a cushion should it be retested.
Price: $80.92/bbl
Resistances: $80.98/bbl, $81.39/bbl, $81.74/bbl, $82.75/bbl, $83.18/bbl
Supports: $80.45/bbl, $79.93/bbl, $79.23/bbl, $78.68/bbl, $78.05/bbl
Psychological: $80/bbl, $75/bbl, November and 2009 highs 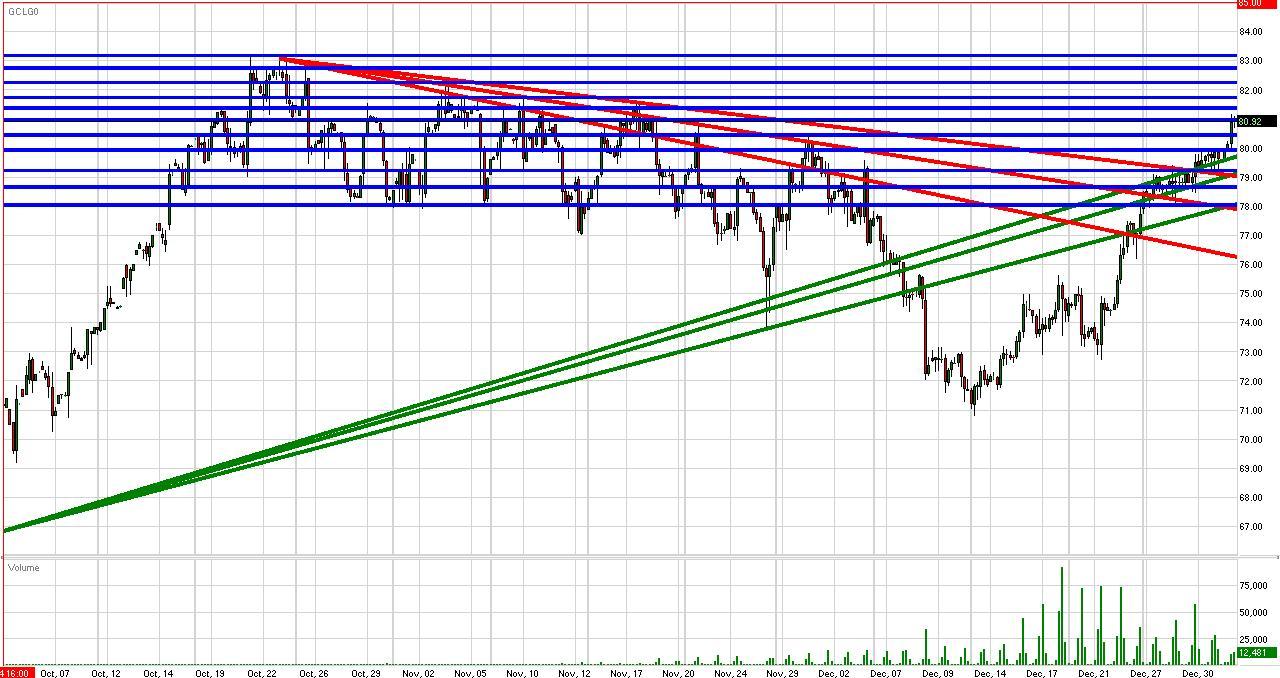
S&P Futures Start off 2010 in the Green
The S&P futures are in the green to start off 2010 as investors react favorably to last Friday’s positive Manufacturing PMI figure from China. Furthermore, the UK released an encouraging data set today with America’s own Manufacturing PMI figure on the way. Meanwhile, the Dollar is weakening across the board with investors favoring the risk trade once again, a positive catalyst for the S&P futures since they have been negatively correlated with the Greenback. It will be interesting to see how the Dollar reacts to today’s U.S. Manufacturing PMI number should it print positively. Strong manufacturing data could lead investors back to the Dollar and drag on the S&P’s intraday gains. On the other hand, weak U.S. economic data may very well move the S&P futures higher since the Dollar would likely weaken in reaction to such a development. Speaking of economic data, the U.S. will also release Pending Home Sales and Factory Orders tomorrow. However, most eyes are on Wednesday’s Non-Farm Employment Change number. A turnaround in U.S. employment triggered December’s rally in both the Dollar and U.S. equities. Therefore, this weekly U.S. employment data could have a considerable impact on the markets. Meanwhile, investors should continue to eye activity in the Dollar and monitor for any aggressive directional movements.
Technically speaking, the S&P futures are riding along their medium-term uptrend as they look to create more separation from the highly psychological 1100 level. As for the topside, the S&P futures face technical barriers in the form of 12/31 and 12/28 highs along with the psychological 1150 level should it be tested. As for the downside, the S&P futures have multiple uptrend lines serving as technical cushions along with the 12/31 highs and highly psychological 1100 level.
Price: 1119.00
Resistances: 1119.75, 1122.5, 1124.75, 1128.75
Supports: 1117, 1113.5, 1111.25, 1109.5, 1106
Psychological: 1100, 1150, 1075, 2009 Highs and December Lows
Disclaimer: FastBrokers' market commentary is provided for information purposes only and under no circumstances should be regarded neither as investment advice or as a solicitation or an offer to sell/buy any financial product. FastBrokers assumes no responsibility or liability from gains or losses incurred by the information herein contained. All materials are property of Fast Trading services, LLC and unless otherwise indicated, any unauthorized reproduction is prohibited.
Risk Disclosure: There is a substantial risk of loss in trading futures and foreign exchange. Please carefully review all risk disclosure documents before opening an account as these financial instruments are not appropriate for all investors.
