Currency Majors Technical Perspective
Valeria Bednarik from FXstreet.com Independent Analyst Team at 01/17/10
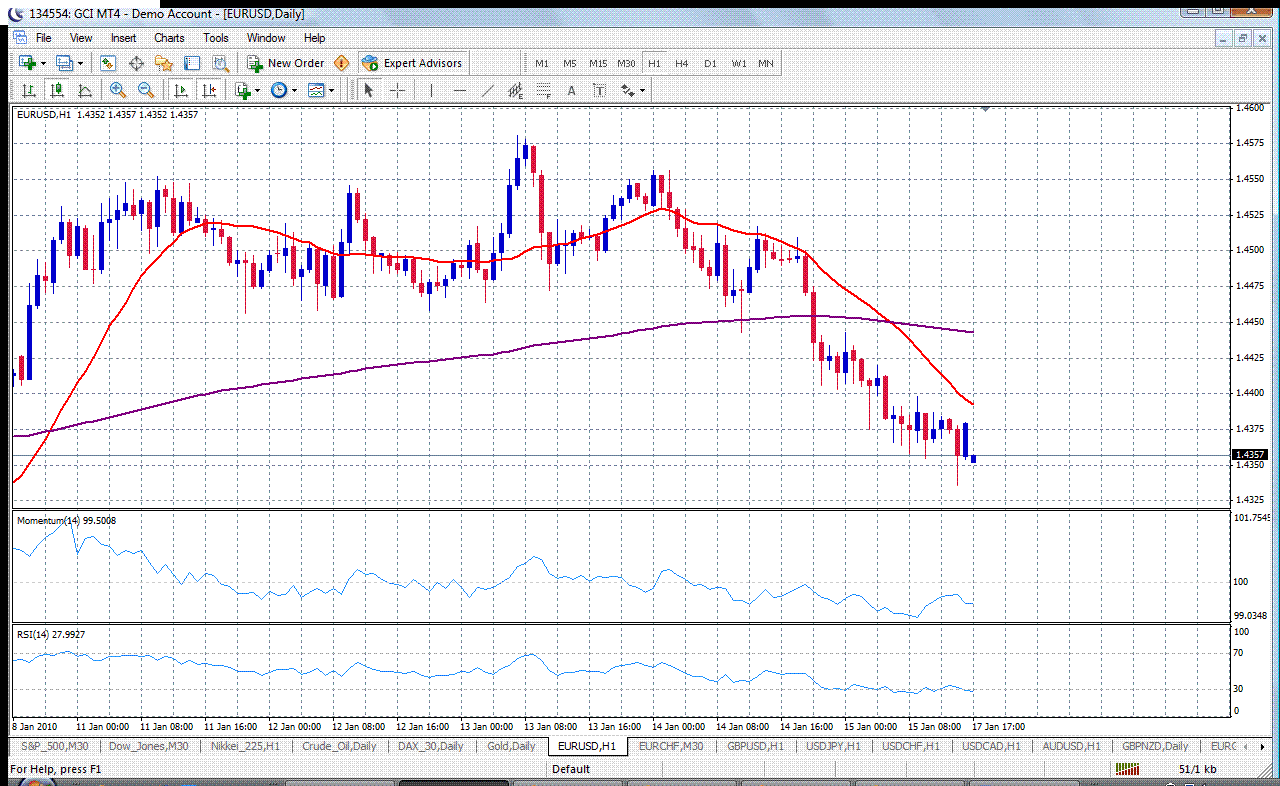
EUR/USD Current price: 1.4357

Euro opened the week slightly bearish, gapping to the downside as some risk aversion due to Dubai World credit issues hit the wires this Sunday. With indicators bearish yet showing downside rally a bit overextended and under 20 SMA still with a nice bearish slope, pair needs to break under 1.4335, past Friday’s low to accelerate to the downside. 4 hours chars support the bias, while in this time frame indicators show pair has still room to extend the fall. Wall Street fall past Friday could weight on local markets and favor greenback in the cross.
Support levels: 1.4335 1.4300 1.4260
Resistance levels: 1.4400 1.4440 1.4480
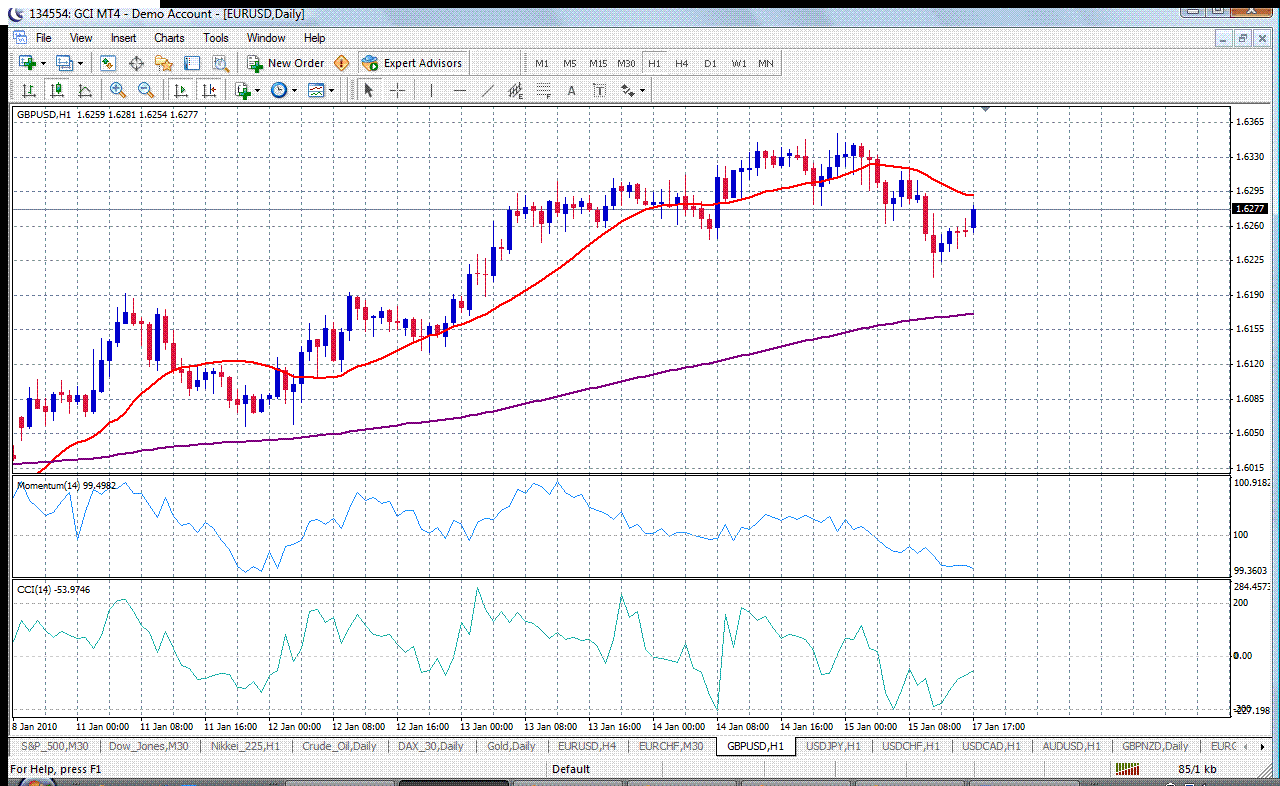
GBP/USD Current price: 1.6277

Regaining some upside strength, pair tested the 1.6200 level past Friday yet returned back above strong 1.6250 zone. With indicators pointing for further upside movements, more clearly in the 4 hours charts, break above 1.6300 area, 20 SMA flat in the hourly chart, could signal further upside pressure to come in next sessions. Watch for an acceleration above 1.6350 area, past week high, to trigger further momentum in the pair.
Support levels: 1.6250 1.6200 1.6160
Resistance levels: 16300 1.6350 1.6380
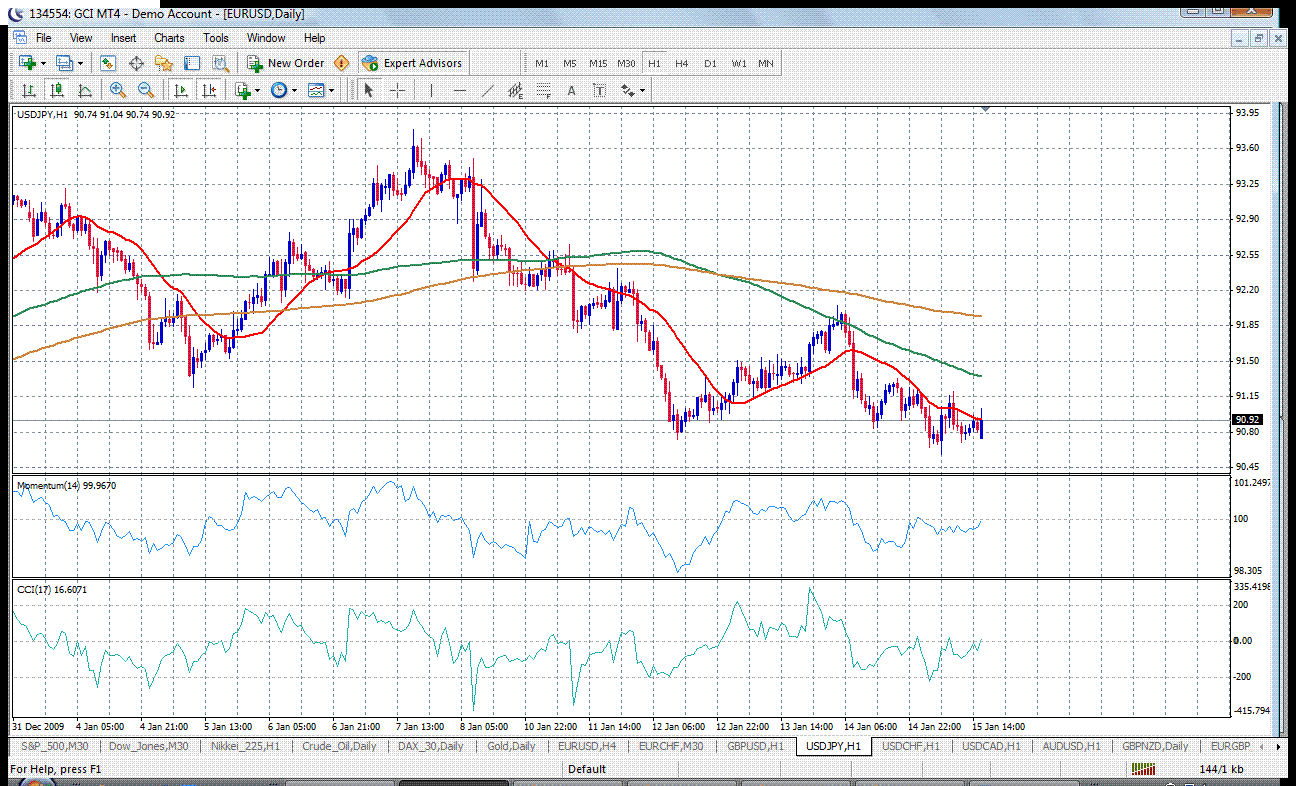
USD/JPY Current price: 90.91

Consolidating in range, pair has bottomed again at the daily 100SMA around 90.50, that has been acting as a downside barrier most of past week; slightly bullish in the hourly chart, pair is still under moving averages with a slightly bearish bias, so we need to the see the pair at least above 91.20, to see some upside strength in the pair. 4 hours charts are barely supportive of the bias, as pair has been mostly range bound past sessions.
Support levels: 90.50 90.30 90.00
Resistance levels: 91.20 91.55 91.90
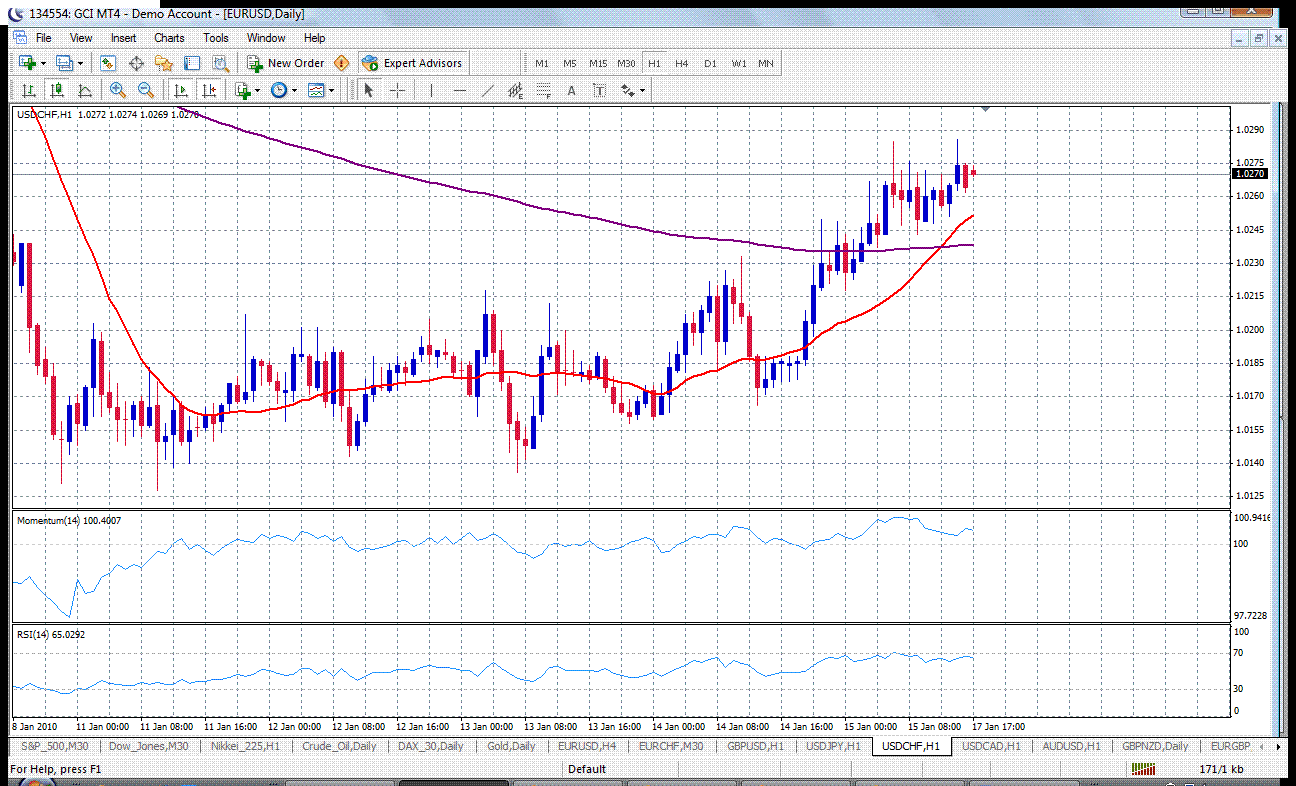
USD/CHF Current price: 1.0270

Consolidating at highs, pair has a slightly bullish continuation perspective for next session, thus hourly indicators seem a bit overbought; corrective movements should remain above 1.0230 support to made the bias valid, while only clearly above 1.0320 pair could accelerate and attempt a rise higher. 20 SMA in the hourly chart support the bias as has crosses downside up 200 EMA, while holding a bullish slope.
Support levels: 1.0230 1.0200 1.0165
Resistance levels: 1.0300 1.0330 1.0370


