

Currency Majors Technical Perspective
Ian G Coleman from FXstreet.com Independent Analyst Team at 01/19/10
EURUSD Current price: 1.4399
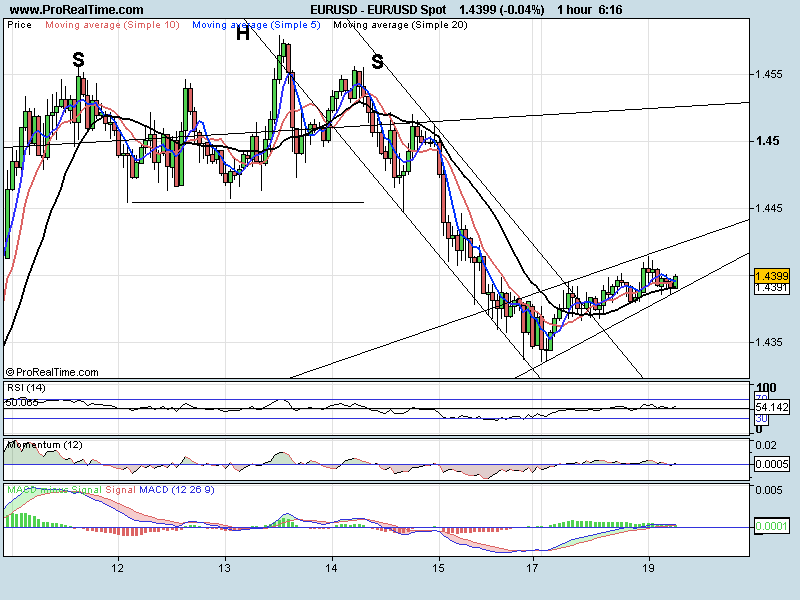
Asian stocks are lower overnight and the USD has weakened. We are in a corrective move higher and the 20 SMA is holding on as support at the moment. All indicators are flat giving no clues of market direction. We may be forming a wedge formation that favours a break to the downside but with yesterday being a US holiday this pattern should be taken with care. A break of 1.4379 should take us down to 1.4334 (previous low) and the trend line at 1.4315. A move higher and we would need to see a break of the formation to signal a move up to 1.4457 and possibly 1.4486. We have the ZEW survey at 10.00 GMT that could well show the bias for the pair.
Support levels: 1.4379 1.4334 1.4313
Resistance levels: 1.4427 1.4457 1.4486
GBPUSD Current price: 1.6414
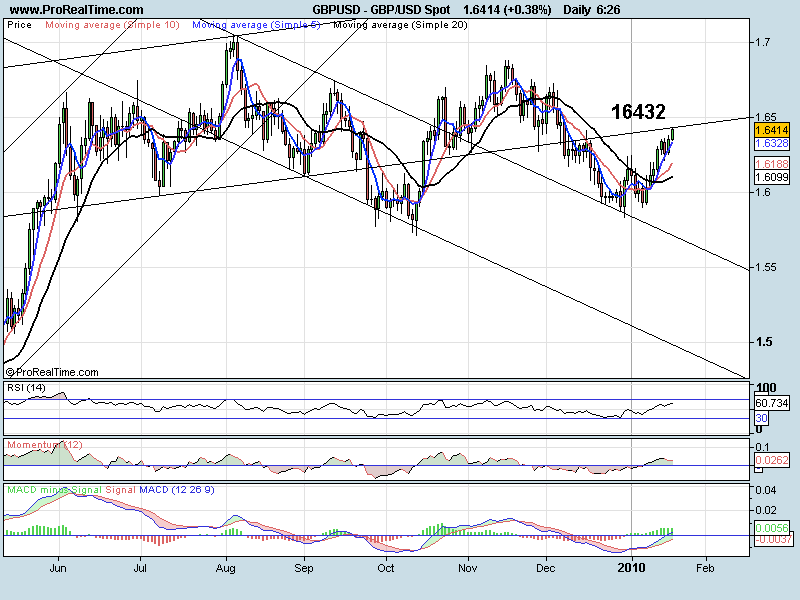
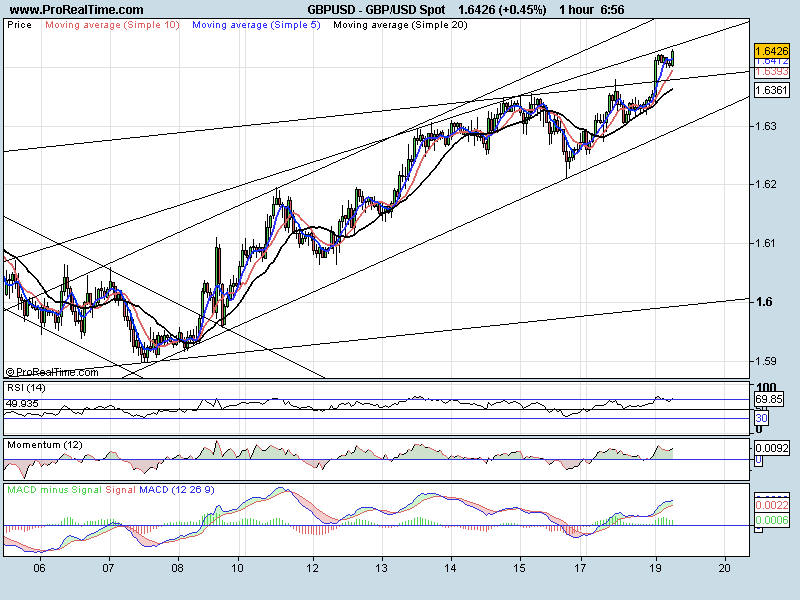
Something we need to be aware of. The Daily chart has resistance (was support) at 1.6432. You can see by the chart that this trend line held well at the middle of December during the push lower. 1hr, and we just keep on pushing higher. Rapid push up overnight as the stops were triggered above the corrective trend line. RSI is now looking overbought so a pullback is possible from the point. If we look to the 4 hr chart we have a previous high at 1.6414 (16th Dec)
Support levels: 1.6379 1.6360 1.6294
Resistance levels: 1.6414 1.6432 1.6484 (61.8%)
USDJPY Current price: 90.45
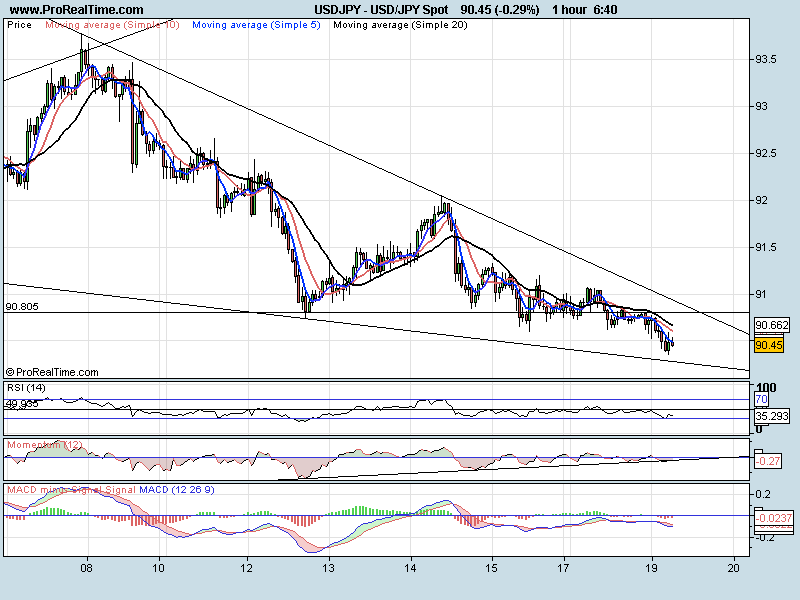
Stayed inside the wedge formation and has moved lower (slowly). Just getting close to the bottom descending trend line at 90.29 where we can expect some support. A trend line on the Momentum indicator is holding well at the moment and also signals a potential bounce from here. To the upside we will need to break the previous support at 90.80 followed by the trend line at 90.92. To the downside a break of 90.29 would signal a move lower but only to 90.00 and possibly 89.80 (daily trend line) before support.
Support levels: 90.29 90.00 89.80
Resistance levels: 90.67 90.80 90.93
USDCHF Current price: 1.0242
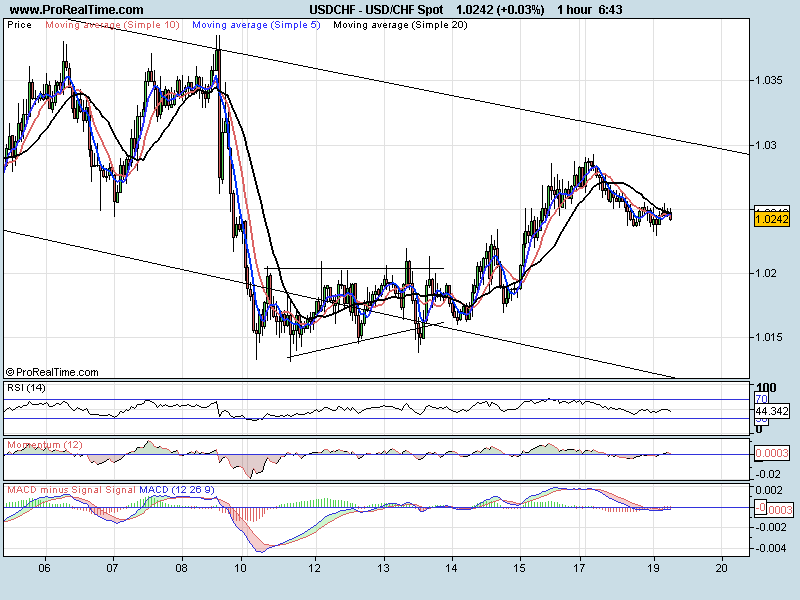
A slow grind lower from the open yesterday, then a flat session overnight. All indicators are flat but we are below the 20 SMA and the 50 mark of the RSI so we have a slight downward bias. In a sideways channel at the moment (1.0255 1.0229) and we would need to see a clear break outside this range to signal the next move. Again, with the ZEW survey out at 10.00 GMT that will affect the EURCHF (and so the USDCHF) care should be taken with any signals before that time. A flag would take us down to 1.0200
Support levels: 1.0236 1.0229 1.0200
Resistance levels: 1.0255 1.0293 1.0303
Have a great day
