

Currency Majors Technical Perspective
Ian G Coleman from FXstreet.com Independent Analyst Team at 01/25/10
EURUSD Current price: 1.4168
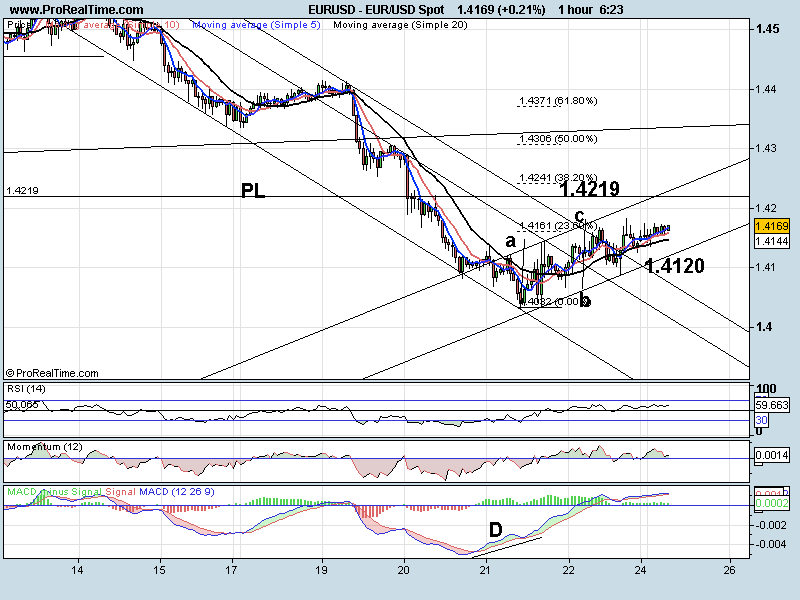
Stocks in Asia are down for the sixth day as the market digest Obama’s plans. EURUSD still moves sideways up in what looks like a corrective channel. Indicators are still looking slightly bullish at the moment but this move may be losing it momentum. An ABC correction has taken us to 1.4182 (84 the high) so we should watch that level for a possible break. If we push through 14184 then 1.4219 breakout trend line is the next resistance, and that area combined with 38.2 %( 1.4241) should hold the move higher. We have the lower trend line at 1.4120.
Support levels: 1.4145 1.4120 1.4070
Resistance levels: 1.4184 1.4219 1.4241
EURUSD Current price: 1.6141
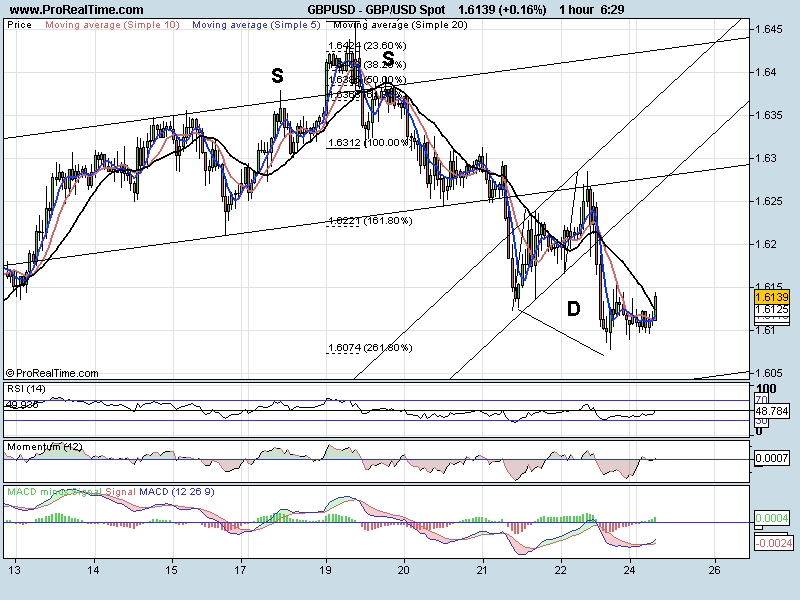
The pair is pushing higher after nearly reaching 261.8% of the first wave (1.6074). We have shown some divergence to buy here and are pushing through the 20 SMA as I write. RSI and Momentum just pushing up into their higher zones (momentum above zero / RSI above 50) so we are looking slightly bullish. I think the move higher will only be corrective before the next leg lower. A break through 1.6096 and we should see 1.6040 major trend line support as the target.
Support levels: 1.6096 1.6078 1.6041
Resistance levels: 1.6154 1.6168 1.6224
USDJPY Current price: 9016
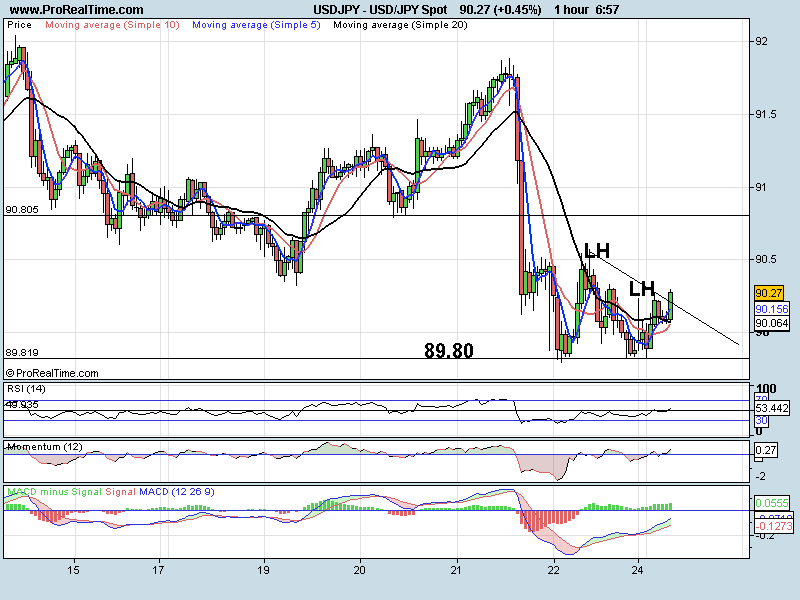
Bit of a mixed picture on USDJPY. 4 hr chart is showing the pair holding onto a descending trend line. 1 hr chart and we see the large move down last week, then finding a base at 8980 and bouncing off this level. We then only made lower highs. This is forming a descending triangle which favours a break to the downside. All indictors are flat. I would watch 9028 for a break higher to 9055. Only a break of this level (9055) would really turn the pair bullish. A break lower and there is little support until 89.00
Support levels: 8980 8900 8847
Resistance levels: 9028 9058 9080
USDCHF Current price: 1.0396
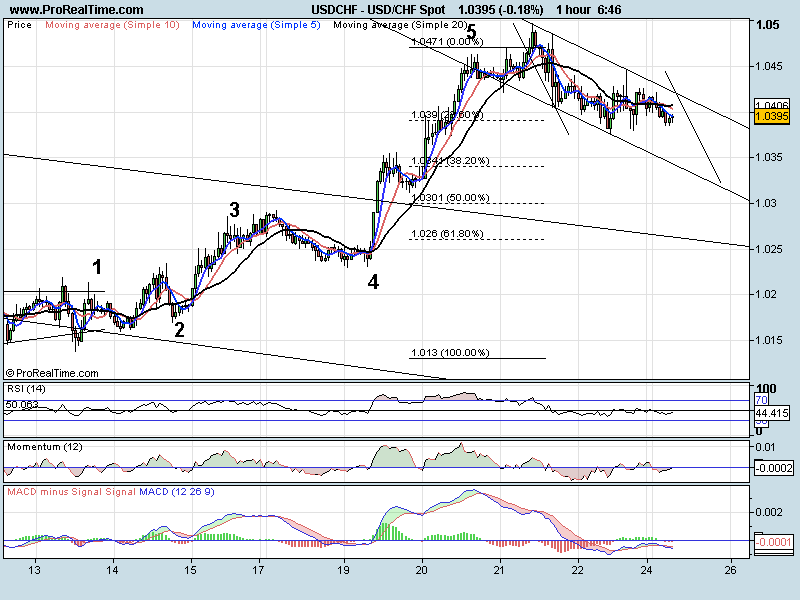
In a downward corrective channel. 10375 could be the low (between 23.6 – 38.2%). At the moment every indicator is looking mixed. A move lower and we have trend line support and 38.2% level at 1.0341. To the upside, we have trend line resistance at 1.0423. A break higher and we should see 1.0450 then 1.0500 as the targets again.
Support levels: 1.0375 1.0340 1.0301
Resistance levels: 1.0423 1.0446 1.0497
Have a great day
