Currency Majors Technical Perspective
Valeria Bednarik from FXstreet.com Independent Analyst Team at 10/29/09
EUR/USD Current price: 1.4718

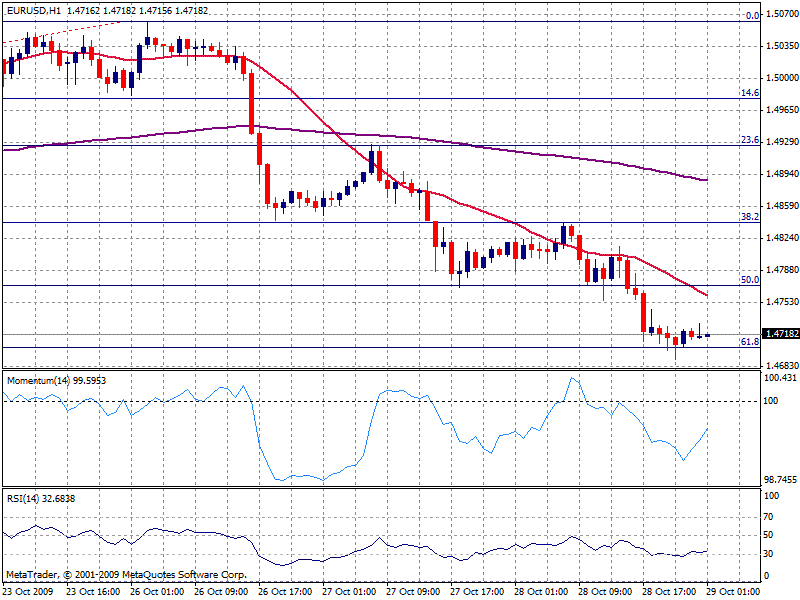
Nikkei 225 opened strongly down 1.3% breaking under 10.000 and reaching 9941, showing risk avert movements are not over in currency markets. Close to yesterday’s low also 61.8% of this month rally, confirmations under 1.4705 will likely send pair lower. Still, hourly indicators remain pointing for some upside corrections that likely remain limited if local stocks continue falling. Bigger time frame indicators also seem exhausted to the downside, yet current candle opening under 200 EMA in 4 hours charts, suggest more downside to come after due correction.
Support levels: 1.4705 1.4680 1.4640
Resistance levels: 1.4740 1.4780 1.4810
GBP/USD Current price: 1.6381

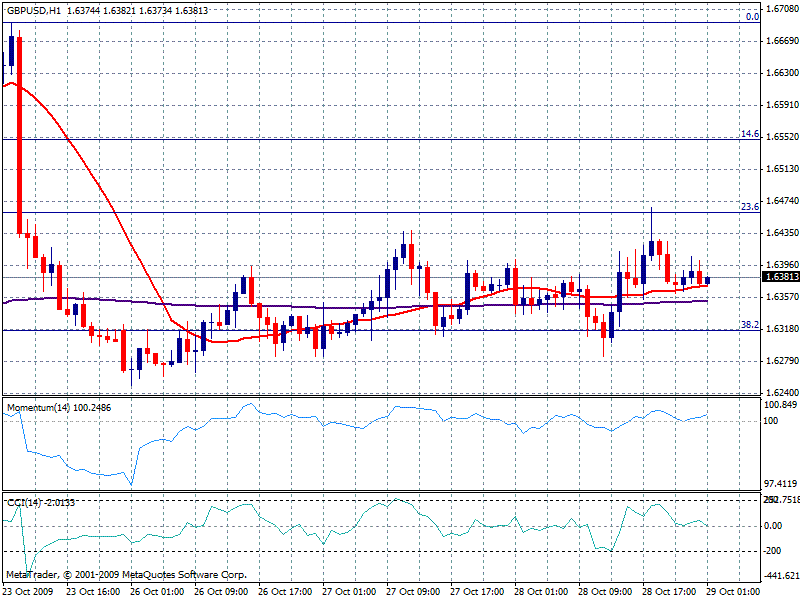
Pair continues moving in a tight range, between Gbp strength and market sentiment. After reaching a higher high in the daily chart, pair failed to remain above 1.6410 area, and seems ready to extend the downside movement, as momentum remains flat as well as 20 SMA. Bigger time frames indicators had a bearish bias, supporting the view. Strong congestion zone between 1.6260/1.6320 will be key as under that level, pair likely to accelerate and break lower.
Support levels: 1.6360 1.6320 1.6280
Resistance levels: 1.6410 1.6440 1.6485
USD/JPY Current price: 90.56

Japanese yen regained upside momentum due to it’s safe haven status, sending the pair lower. Forming a continuation figure, pair needs to move under 90.40 to confirm the downside bias; moving under 20 SMA in the hourly, that holds a strong bearish slope, bigger time frames show some strong downside momentum, suggesting more downside pressure for the sessions to come. Above 91.30, not seen at this point, pair will deny previous view and resume uptrend
Support levels: 90.40 90.10 89.75
Resistance levels: 90.85 91.30 91.70
USD/CHF Current price: 1.0270

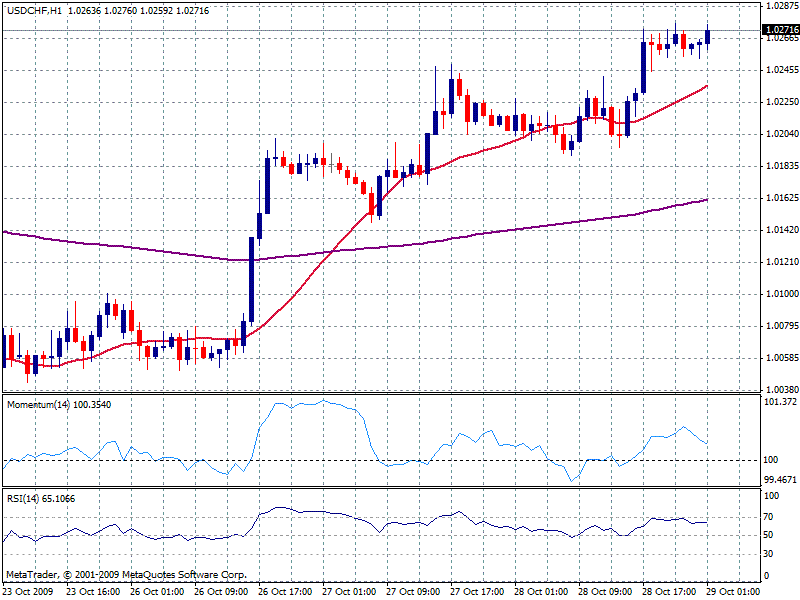
Gaining the upside, pair continues ignoring overbought readings coming from both 1 and 4 hours charts, and points for a break above past Wednesday high. Crossing 200 EMA in the 4 hours charts, confirmations above current price will confirm further rises, with 1.0320 as next key strong resistance level to overcome. Downside corrections should remain above 1.0200 to keep the bullish perspective valid.
Support levels: 1.0235 1.0200 1.0170
Resistance levels: 1.0320 1.0350 1.0390


