Currency Majors Technical Perspective
Valeria Bednarik from FXstreet.com Independent Analyst Team at 12/10/09
EUR/USD Current price: 1.4753

Recovering the upside after better than expected U.S. Trade balance, pair is breaking above a short term descendant trend line top of a triangle that must be discarded if current candle extends. Close to daily high of 1.4760, and with a slightly bullish tone, pair needs to break above static resistance area around 1.4780 to confirm further rises during next session, and only under 1.4680 pair could change intraday bias to strongly bearish.
Support levels: 1.4720 1.4680 1.4620
Resistance levels: 1.4780 1.4820 1.4860
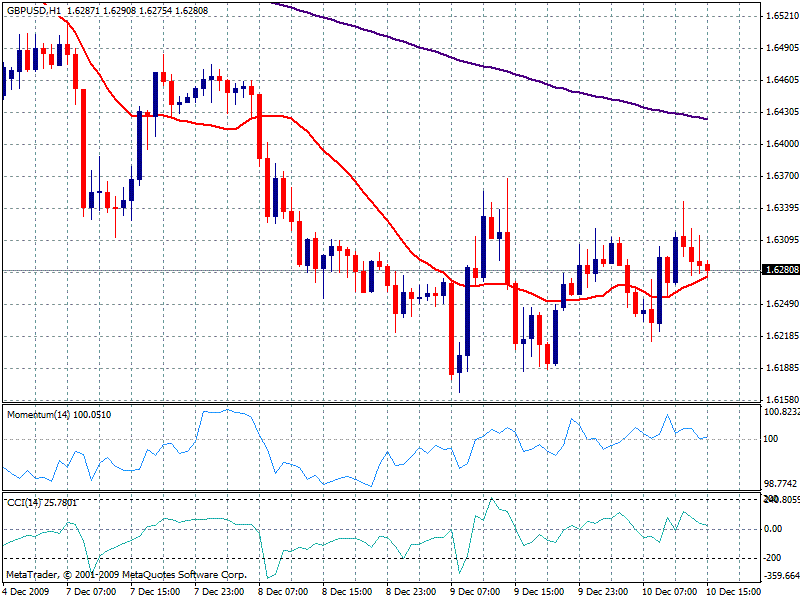
GBP/USD Current price: 1.6281

Pound continues moving against the crowd and is falling against greenback after BOEs’ decision. Pair is testing the 20 SMA in the hourly chart, while indicators had lost strength and are turning to the downside. Pair should approach again to the 1.6250 key zone, neckline of the daily H&S formation. 4 hours indicators are also losing previous upside momentum support the view.
Support levels: 1.6250 1.6200 1.6160
Resistance levels: 1.6330 1.6380 1.6420
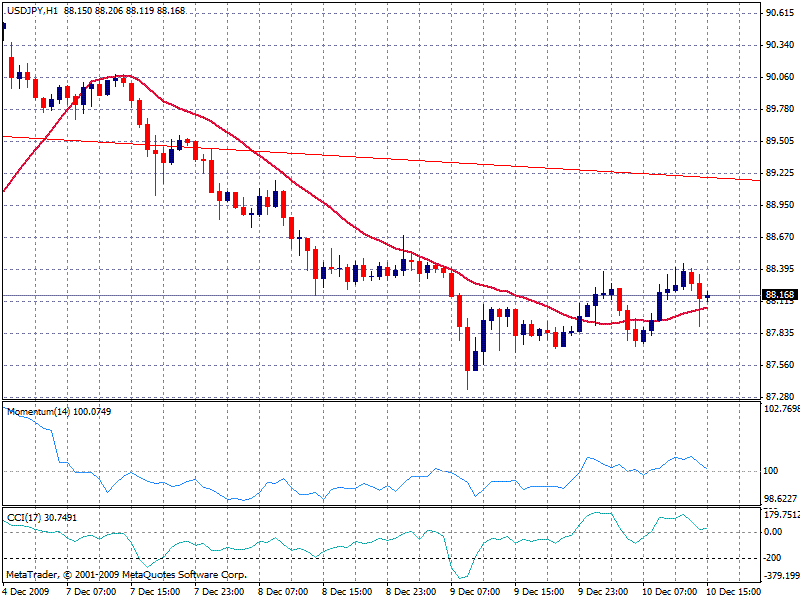
USD/JPY Current price: 88.16

Above 88.00, pair remains ranging thus bias remains to the downside as 1 and 4 hours indicators suggest so. Under 88.00, expect the pair to retest key 87.70 support zone, and accelerate to the downside under that level. Only above 88.60 pair could turn positive for today.
Support levels: 88.00 87.70 87.40
Resistance levels: 88.30 88.60 89.00
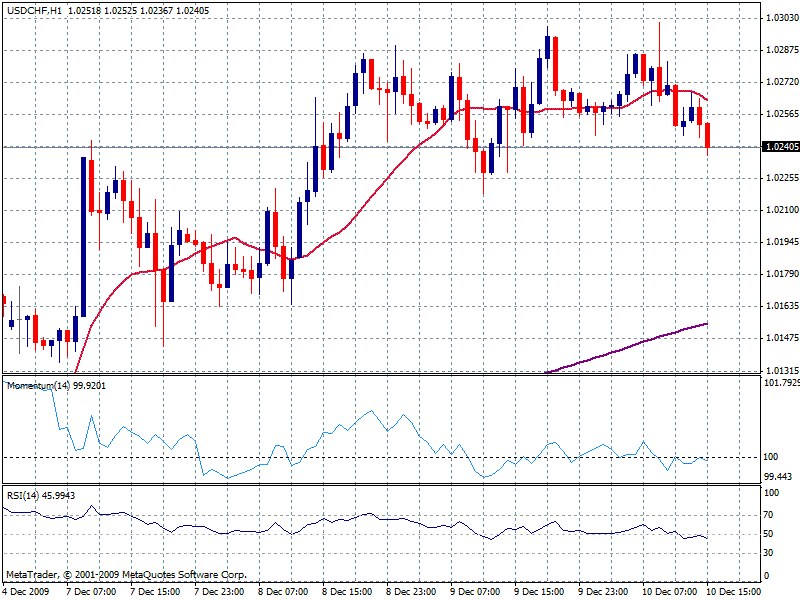
USD/CHF Current price: 1.0238

Testing key 1.0240 support area, pair has turned slightly bearish in the hourly chart, thus needs to clearly confirm under current zone to extend the rally to next 1.0200. If this last holds, current movement could be considered corrective, and pair should regain the upside after a rebound. 4 hours charts show price reaching 20 SMA still with a bullish slope, so further falls should remain limited, unless a clear downside acceleration trough the moving average.
Support levels: 1.0240 1.0200 1.0170
Resistance levels: 1.0280 1.0300 1.0345


