Fed Outlook Adds to Greenback Strength
Fan Yang from CMS Forex at 02/22/10
Fed Outlook Adds to Greenback Strength
Last week, Eurozone’s debt issues and announcement of tightening in Chinese banks extended the current atmosphere of risk aversion, which weakened the Euro, but boosted the US Dollar and Yen. This week, the Yen and Greenback consolidated, but the Greenback broke out and continued its strength. The USD was boosted after the Fed raised discount rates from 50 to 75 bps, a possible implication of nearing loosening monetary policy overall. Let’s take a look at what this week shapes up for the coming weeks.
EUR/USD: Fed Raises Discount Rate
GBP/USD: Continuation

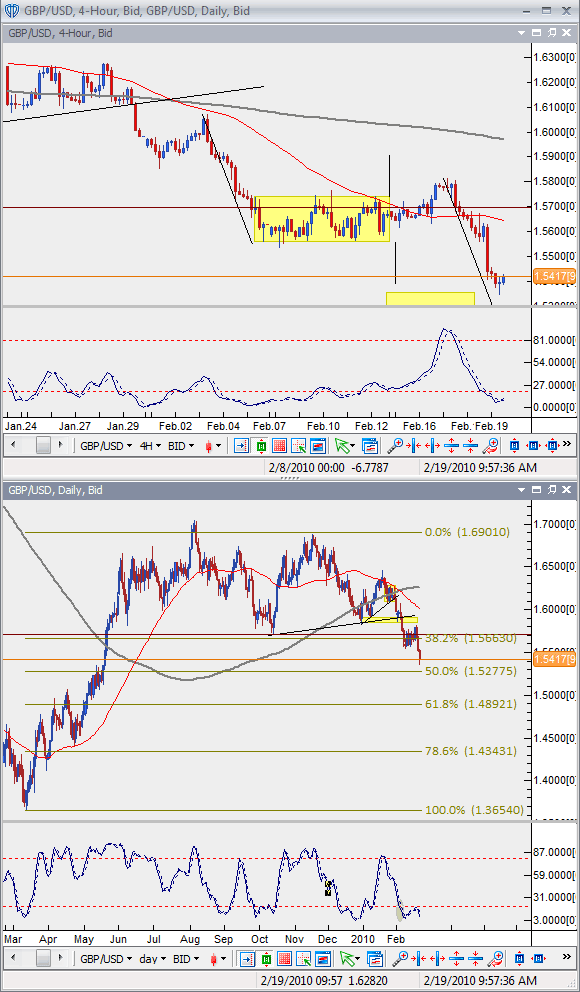
4H and Daily: Last week, the headline for the GBP/USD was the continuation scenario, which after some further consolidation materialized. The clear-out on the upside suggests weakness of bulls, and confirms strength of bears for this pair.The daily chart shows the stochastic reflective of strong bearish continuation. While the market is at a near-term support above 1.53, the next level of support is 1.50 (61.8% retracement).If this is broken, the market will likely reach a full pattern breakout (of the entire 2009 range) to the 78.6% retracement, 1.43 area.In the short-term, look for the pair to have a bit of correction next week. Allow the market to rally and bring the momentum up from oversold. Then if topping action occurs before any major bullish move, the probability heightens towards 1.50.
USD/JPY: Is Retracement Done – YES

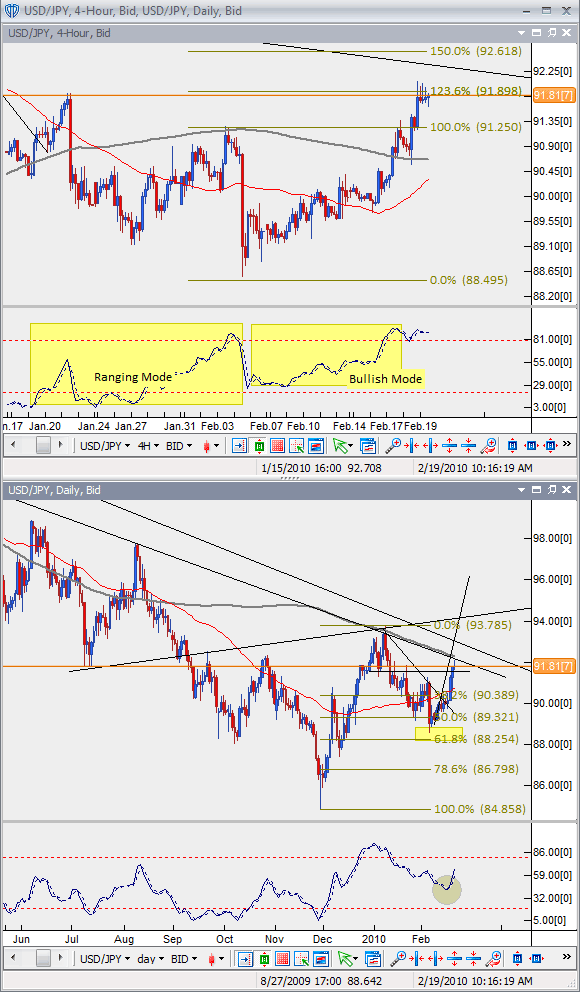
4H and Daily: The question posed last week, whether the recent retracement decline is over, is YES. The stochastic in the 4H has turned from ranging into bullish mode. The point about the ranging mode changing to bullish mode might be better demonstrated if you look a little further back in the stochastic, which has ranged from ob to os. The latest rally showed bullish dominance.I have been stalking this pair for a while now, and the daily chart shows pretty much what I expected. The stochastic is supported in the bullish zone, and price action is very strong in the daily.The obvious short-term bullish mode might carry over to the intermediate/long-term, if the market can rally across the upcoming trendlines, then the necline of the reverse head-and-shoulder.A swing projection of the previous rally is to the 98.00 area, but if this is wave III, further rally can be expected.
USD/CAD: Failed Double Bottom

Daily and 4H: The USD/CAD looked like it was ready to reverse. The stochastic was going to stay bullish with a crossover, while prices held at 61.8% retracement.Friday session bearish candle is indicative a bearish momentum returning and might push the pair to the 1.0340 area by next week.4H: The stochastic was showing promising bullish takeover, IF the stochastic was able to hit the overbought zone. But price action reversed after rallying to 1.0530 and a strong bearish candle brought the pair back to its short-term support zone.The market may still be bullish, if this zone holds, or even if the market goes to the 1.0350 area.We should see next week, if the current bout of expanding consolidation will narrow. Then a breakout may better indicate the direction to follow after the current retracement decline.Further decline would face support at 1.02 area. A rally, indicates possible Wave III., and a swing projection of at least 100% the previous upswing.
EUR/GBP Still in Consolidation, Testing Long-term Support

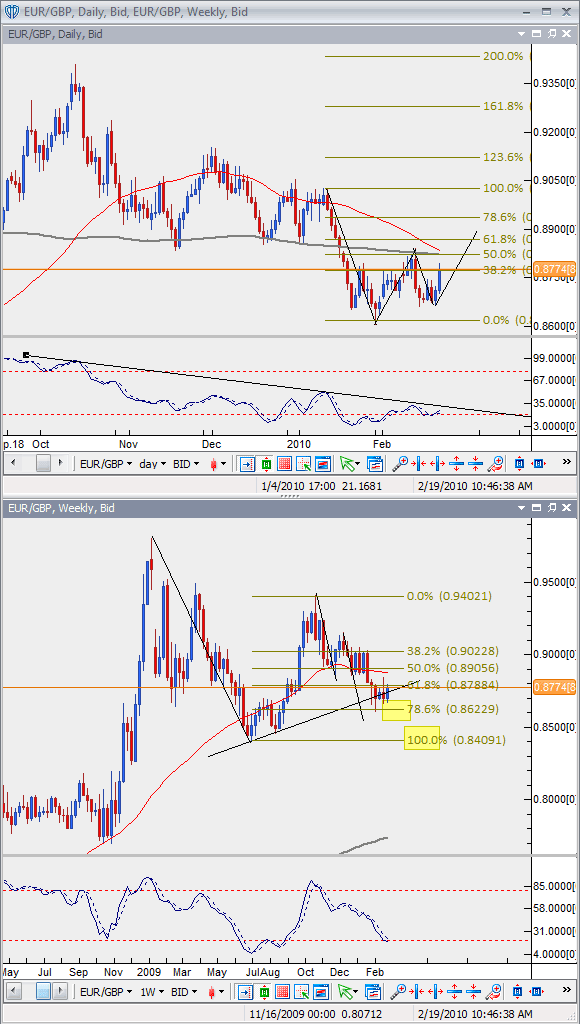
Daily: After a bearish retracement pattern last week, the market indeed declined. However, it was not even close a swing projection and did not even reach the previous low. Candlestick combination would have warned you against the bearish outlook.The current short-term rally might bring the pair back up to the 0.8850/0.89 area, and complete a bearish gartley. IF the market can top and reverse to break below 0.8650 (where upsloping trendline would be), then the market can continue declining, and it would be an intermediate to long term decline.Weekly: The weekly picture shows that the market has been in a long-term consolidation since 2009. You can see a possible triangle developing. That is, is the market is support at the current short-term consolidation pattern.However further decline eyes the 0.84 area in intermediate termTeh bullish outlook, in the short-term would be triggered if the market climbs above 0.89. The short-term target for that rally would be the downsloping resistance (not drawn here), which would be in the 0.91-0.92 area.
GBP/JPY: Stalking Retracement Pattern
AUD/USD – Stalking Bullish Swing

Daily and 4H: The AUD/USD continues to be strong within the context of a consolidation range seen in the Daily.The 4H time-frame shows the detail of the current upswing, and a possible Elliott wave count that is finishing c wave of Wave IV correction. If so, there is another terminal wave.Looking at the daily, if wave V is 61.8% of wave IV, it would be coincident with the 78.6% retracement and near the test of the downsloping resistance.This projection 0.915-0.92 continues to be valid.
Fan Yang
Currency Analyst
Commodity Trading Advisor
fyang@fxtimes.com


