

GBP continues to perform well as the CPI came in higher than expected
Per-Erik Karlsson from Avantage Financial GMBH at 01/19/10
Market Comment
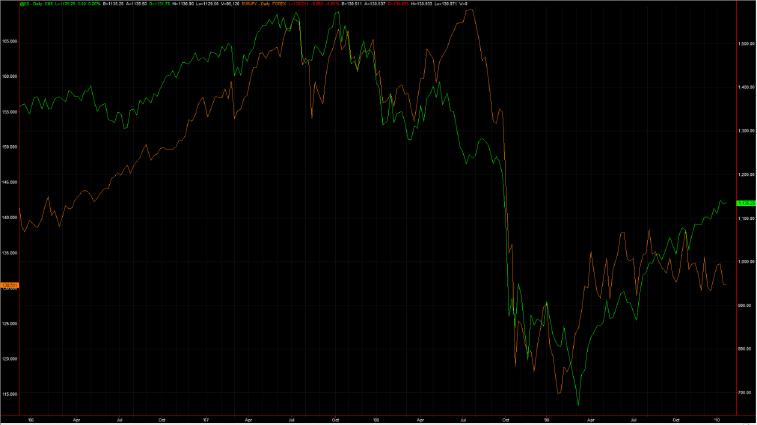
S&P 500 futures trading lower over night following the bearish formation on daily chart Friday, with a wide spread down bar, a bearish engulfing pattern in candlestick terms. This confirms the weakness from Monday last week that looked like an up trust, meaning market players take prices above a resistance level to trigger stops only to drive the market lower later on. So we are still looking at possible shorts if the right signal present itself, not seen it yet. The price action following the JP Morgan and Alcoa better than expected might signal as shift in the market sentiment to higher demand from investors of top line growth and not only cost cutting. We believe this will be very important going forward and we will focus more attention to the top line numbers and the companies forward looking statements than the actual earnings number. There have been quite a bit of news stories out lately focusing on the debt problems of Greece and other Euro zone member that might face downgrades. We actually think the increasing public debt will become an issue sooner or later this year and we expect this to be more reflective in the exchange rates. Countries that catch our attention are: Japan with the highest public debt in the G-10, UK and USA. The price action in EURUSD so far this year has really been driven by the Greece issue and problems of the Euro zone, meaning that EUR struggles every session this theme has been on the agenda in form of news article or Central Bank speak. JPY also struggled over a few days when there was debate over the ability to finance their debt. So with this in mind, we have put in a chart with S&P 500 futures vs. EURJPY over the last 2 years. It displays clearly that the correlation between the two contracts have fallen from start of November 2009. We used to use EURJPY as a risk appetite parameter, but not looking like the correlation to S&P it is working all that well lately. Is that a change of correlations or more indicating that either S&P or EURJPY is mispriced and a stronger move is on the way? Not sure yet, but we pay attention to EURJPY to find any clues over the next few weeks. Crude outlook remains weak with prices below 78 USD per barrel this morning and following the inventory data last week with huge builds across the line from both API and DOE we expect the tone to continue to be weak also start of this week. The weather in the US has turned a quite a bit warmer as well, which is bearish for Nat Gas. Investors continues to buy spot and store it in tankers and sell the deferred futures to lock in a “risk free” return. In the long run as the supply that is put on storage have to come back to market sometime in the future, meaning the supply is still there in the background. So, several bearish factors are playing on the price for now. Gold is trading at 1134 this morning and we see interim rising support from the Dec 09 low coming at 1123 today and while above this rising support the outlook remains bullish. The test of the 1075 level was successful on 22nd of Dec., which should provide strong support in the background. AS we wrote over the last week, any strength in JPY should be viewed as another opportunity to sell JPY and indeed it tested 90.50 to 90.70 (former break out level) again this morning, which we see as a good short term level to trade long from. EURJPY should see decent support in the 130.00 level. GBP continues to perform well as the CPI came in higher than expected this morning along with an article in the FT “Darling sharpens axe on spending”, taking EURGBP to the lowest level since September 2009. We have seen several hawkish comments on UK over the last week, suggesting that a rate hike is being priced in more aggressively now, giving support to GBP.
Beijing continues to tighten monetary policy allowing the one year T-bills to rise another 8 basis points today.
EURJPY vs. S&P 500 futures, see how the correlation has been totally off the last few months.
| ATM | 1w | 1m | 3m | |||
| put | call | put | call | put | call | |
| EURUSD | 9,19% | 9,19% | 9,84% | 9,84% | 10,55% | 10,55% |
| GBPUSD | 9,82% | 9,82% | 10,40% | 10,40% | 11,12% | 11,12% |
| USDJPY | 10,86% | 10,86% | 11,83% | 11,83% | 12,81% | 12,81% |
| USDCHF | 9,71% | 9,71% | 10,12% | 10,12% | 10,79% | 10,79% |
| AUDUSD | 10,79% | 10,79% | 11,90% | 11,90% | 13,19% | 13,19% |
| USDCAD | 9,90% | 9,90% | 10,31% | 10,31% | 11,74% | 11,74% |
| EURJPY | 11,74% | 11,74% | 11,91% | 11,91% | 13,11% | 13,11% |
| GBPJPY | 13,58% | 13,58% | 14,42% | 14,42% | 15,57% | 15,57% |
| AUDJPY | 13,37% | 13,37% | 14,62% | 14,62% | 16,27% | 16,27% |
| NZDJPY | 14,39% | 14,39% | 15,53% | 15,53% | 17,08% | 17,08% |
| EURNOK | 5,76% | 5,76% | 6,66% | 6,66% | 7,34% | 7,34% |
Technical’s
Euro: Was never able to reach the resistance at 1.4630 and broke lower Friday, bearish tone below 1.4450 now with 8th of Jan 2010 low of 1.4262 being support.
Cable: Held at 1.5895 last week, which gives a higher low than previous week. That is bullish in itself and the interim falling resistance was taken out yesterday, possible for a test of 1.6410.USDJPY: We see longer term falling trend line coming in at 94.10, which is still the key level to break to open for a stronger run higher. We expect sellers to use this level to look for a correction on the strong run from the 85 at 27th of Nov 09. We have 50% Fibonacci of the move from 84.83 to 93.76 coming in at 89.29 and we expect buyers to step in towards this level. Longer term we still expect JPY to underperform due to high public debt, weak demographics and tougher export markets due to slower growth going forward.
Swissy: Trading inside a triangle on daily chart with rising support coming in at 1.0164 and falling resistance at 1.0289 today, which are the levels to watch for now. Any break in either direction could open for a more directional move.
AUDUSD: Broke the interim rising support line overnight and recent uptrend is broken. Expect to see a test of 0.9120 or so next. Key resistance remains up at the Nov 09 high of 0.9405.
USDCAD: Still expect the 1.04 to continue to be a main pivot level in the near future. So while below the 1.04 level it remains bearish. Key support is down at 1.0205 (low from October 09) and this support level has been tested a few times over the last week, but held so far, maybe another approach would deal the final blow out punch?
EURJPY: Have minor support in the 130.50 region today, with stronger support down at 129. Key resistance level is last reaction high at 134.56 (Dec 2009 high).
GBPJPY: All over the place lately, but bullish above 146, with strong resistance up at 151.
AUDJPY: Still trading inside the Rising trend channel from 13th of July with support down at 78.54 and overhead resistance at up at 88.58. Right in the middle of this channel at the moment and no real levels to trade off at the moment.
| Levels | Euro | Cable | USDJPY | Swissy | AUDUSD | USDCAD | EURJPY | GBPJPY | AUDJPY |
| Res2 | 1.4625 | 1.6719 | 94.10 | 1.0507 | 0.9405 | 1.07 | 134.54 | 150.66 | 88.58 |
| Res1 | 1.4556 | 1.641 | 93.7 | 1.0314 | 0.932 | 1.04 | 133.7 | 149.45 | 85.3 |
| Sup1 | 1.4216 | 1.6135 | 89.18 | 1.0157 | 0.912 | 1.0205 | 129.00 | 146.77 | 78.54 |
| Sup2 | 1.4044 | 1.5895 | 87.34 | 0.9959 | 0.863 | 1 | 127.32 | 145.99 | 76.54 |
| Pair | Our strategy Today | Our medium term forecast |
| EURO | Bearish below 1.4450, next sup is 1.4262 | Test of 1.4200 over the next week |
| Cable | Bullish for a test of 1.6410 this week | Negative outlook for GBP longer term |
| USDJPY | Profit taking as 94.35 level held, 90.60 should provide support and looking enter long down there if possible | Test of 94.42 |
| USDCAD | 1.04 is pivot level, bearish below, sell rallies, key support is 1.02 | Test of 1.02 next 4 weeks |
| EURJPY | Should bounce from 130.50 | Our 133.70 target reached |
| AUDJPY | Expect more JPY weakness and AUDJPY should head higher, but need lower levels to be attractive for longs | 85 target hit |
| GBPJPY | Bullish above 146, looking for 151 test again | 153 target hit, stand aside |
| AUDUSD | Uptrend broken, looking for a test of 0.9120 | Test of 0.9405 |
