NASDAQ − Resisting Change?
Andrei Pehar from fxKnight.com at 12/16/09
Like the Dow and the S&P 500, the NASDAQ has been rising fairly steadily since March of 2009. The NASDAQ is interesting in that it is both an index, and a place where investors trade stock electronically. As an index (an average of numbers derived from the movements of particular stocks), it measures 4,000 stocks as opposed to the Dow which measures 30.
In the past few weeks though, the NASDAQ has done something it has not done since it began its climb back uphill in March.
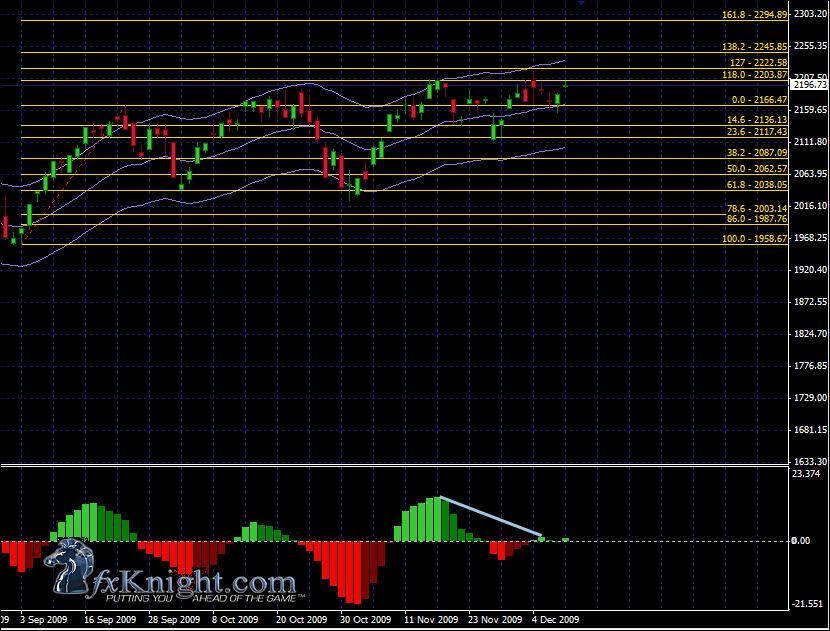
Unlike the Dow which has been in a tight range the last several weeks, the NASDAQ has hit resistance twice at exactly the same level and bounced back down forming a double top.
So is this the end of the upward swing for the NASDAQ?
The 118% Fib extension level it hit at 2203.87 is not the long term target for this index. The 161% level at 2294.89 is the long term target. Not all Fibs hit their long term targets, but by far the majority do. If you follow us on Fibonacci Friday, you know that 77% of these Fib patterns are profitable. You may also be aware that an instrument may stray for a while when it hits a strong support or resistance level and then return to hit its target at a later date. On this chart you also see divergence in the OsMA indicator which indicates a movement of undetermined size to the down side. It is possible that there is another divergence forming and possibly a triple top as well, however the candle on the far right is not complete, and it is too early to tell.
So, let's see where the NASDAQ could go from here…
If the 118% Fib level at 2203.87 is broken as resistance and retested as support, price could be back on its way towards the 161% level at 2294.89, with resistance along the way at the 127% level at 2222.58 and the 138% level at 2244.85
On the down side, the 23% Fib level at 2117.43 would have to be broken as support and retested as resistance. It would probably then go down to the 61% level at 2038.05 as there have already been two bottoms at this point. There could also be support at the 38% level along the way at 2087.89 and the 50% level at 2062.57
Most likely, it is going to range for at least a short period of time between the 23% level at 2117.43 and the 118% level at 2203.87, possibly narrowing to the 0% level at 2166.47 while it decides what it is going to do next.