

Trading the Breaks −−−− USD/CAD
Basil Fayadh from eToro USA at 01/25/10

In the currency markets, a very common term in trading is called a break. So if we refer to USD/CAD on a (daily) time-frame. We see that it is breaking on the upside. What this means is that the U.S.dollar may be getting stronger than the Canadian dollar. The current level right now is around 1.0582, and this level currently is resting just above the trendline, and 100 day moving average. The second line above represents the 200 day moving average. (see notes below for definitions)
Now that we have established what everything on the chart means, let's take a closer look at how we could possibly trade this chart. Remember, besides technical analysis, you have to take a look at fundamental events as well to give you direction on the trade. With the current chart, we have seen that the U.S. dollar has been getting progressively weaker against Canadian dollar since March 9, 2009 at the high of 1.3061 which is represented by the top left of this chart where the trendline started (For more info on how to draw trendlines, there are many technical analysis books that can be consulted, but I would recommend John J. Murphy's Technical Analysis of the Futures Markets. So as we can see the trendline was broken around the 1.0510 level and head towards the 1st moving average around 1.0570. The downtrend and the 100 day MA represent resistance levels The next resistance level is the 200 day moving average around 1.0930 which would be the target if current levels hold.
What must be realized is that when a currency breaks usually we can see a re-touch. A retouch is a break of current support and resistance, and then a move back to this support/resistance to see if it holds! Be careful traders! A lot of traders will get long or short a position, only to be knocked out after large hedge funds, or banks buy/sell protect their positions on the other side. What does this mean? Many speculators will go long or short, (as we are all looking at the same chart), and the other side of this trade, needs to be taken somewhere usually by the Futures Commission Merchant or Forex Dealer Member, then this risk needs to be offset. Someone has to take the other side. But, they will be able to get rid of this unwanted position by selling/buying massive amounts in the opposite direction! So careful money management, stop positioning, and timing are a must. In my opinion, if a trader can have the patience to wait for an open above resistance or support it may be a better idea than to jump in on the first break, but this is just this is just my personal strategy.
Please see my previous link to USD/CAD a few weeks ago and note that we were looking for these levels which have now currently been breached.
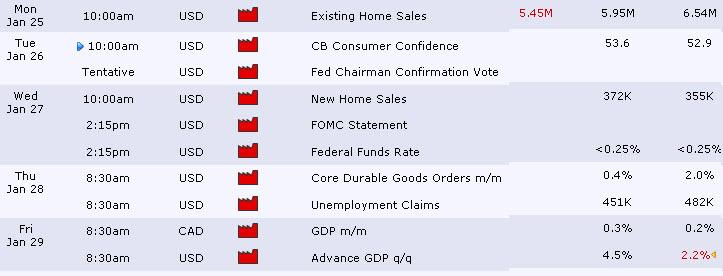
Notable U.S. and CAD fundamental events this week which could have an an effect on this trade. First numbers are expected numbers and second are previous releases. We are looking for releases that are better or worse than expected, which could have a positive/negative impact on the host country currency.
Good Luck! Good Trading!
Break- Term used to describe price moving higher through a resistance level or lower through a support level.
Moving Average-Moving averages measure the average price or exchange rate of a currency pair over a specific time frame.
Open- The initial price of a given security or commodity in a trading session. Also known as opening.
Resistance-The price level in which a currency pair has difficulty trading above. At resistance, price action tends to stall before breaking above, or reverse in the opposite direction.
Support-A price level in which a currency pair has difficulty falling below. At support, price action tends to stall before breaking below, or reverse in the opposite direction.
Trendline-A form of technical analysis formation created by drawing a line that connects a series of descending tops, descending bottoms, ascending tops or ascending bottoms.
Trendline-A form of technical analysis formation created by drawing a line that connects a series of descending tops, descending bottoms, ascending tops or ascending bottoms.
Technical Analysis-he art of forecasting price movements through the study of chart patterns, indicator signals, sentiment readings, volume and open interest.
Unlike fundamental analysis, technical analysis does not focus on economic data, but rather on interpretation of price data. One of the key tenets of technical analysis is that price patterns repeat themselves, allowing technical traders to make highly probabilistic bets on the direction of the instrument.
FX lends itself particularly well to technical analysis because it trades 24 hour per day and therefore provides a continuous stream of data that can be used for statistical analysis.
Calendar from forexfactory.com, glossary from FX Words, and charts powered by FX Solutions Accucharts
