

Trading the Breaks −−−− EUR/JPY
Basil Fayadh from eToro USA at 01/26/10
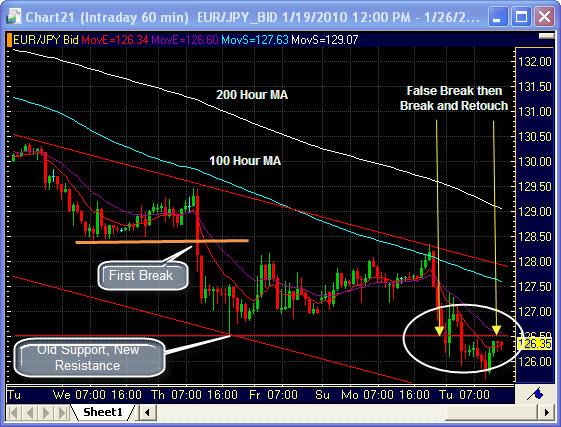
Continuing from my posting yesterday it is important to notice when a currency pair is breaking in order to determine an entry point, we will talk about an exit strategy in future posts, although visually, you can probably get the idea just from glancing at the chart. We are looking at an hourly chart of EUR/JPY, from last Tuesday forward, and can first notice that EUR/JPY is in a downtrend on this chart just below the 100 hour Moving Average, above that we are looking at the 200 hour Moving Average with the dark red line above the trend known as the downward trendline.
The first thing that we notice is that EUR/JPY "broke" on 1/21/10 around the rate of 1.2835 and came to settle at support (long line labeled old support, new resistance). It then came all the way back up to hit the 100 hour MA and downtrend line (both of which are resistance points), it then traded back down to the old support level and looked like it was breaking through but never opened below support. This was what is called a false break. It then came back up and finally came back through support and opened below that level trading down to 125.63. The pair finally retraced back to the old support level (now resistance and is trading just below that now).
So, you ask yourself, "If I trade the breaks, shouldn't I have gotten in when it broke below support?" Well, not necessarily, in my opinion a safer way to play that is to wait for the break to be confirmed (open below) and look for the re-touch as your entry point. Yes, you must also be on the lookout for the open below and no re-touch, but you will have to confirm this on your own as your trading level increases with time. Also remember to look at daily, 4-hour, 60 minute and 15 minute time-frames to confirm trend, and direction from longer-term to short-term.
More to come on "Trading the Breaks" in future posts!
Break- Term used to describe price moving higher through a resistance level or lower through a support level.
Moving Average-Moving averages measure the average price or exchange rate of a currency pair over a specific time frame.
Open- The initial price of a given security or commodity in a trading session. Also known as opening.
Resistance-The price level in which a currency pair has difficulty trading above. At resistance, price action tends to stall before breaking above, or reverse in the opposite direction.
Support-A price level in which a currency pair has difficulty falling below. At support, price action tends to stall before breaking below, or reverse in the opposite direction.
Trendline-A form of technical analysis formation created by drawing a line that connects a series of descending tops, descending bottoms, ascending tops or ascending bottoms.
Trendline-A form of technical analysis formation created by drawing a line that connects a series of descending tops, descending bottoms, ascending tops or ascending bottoms.
Technical Analysis-he art of forecasting price movements through the study of chart patterns, indicator signals, sentiment readings, volume and open interest.
Unlike fundamental analysis, technical analysis does not focus on economic data, but rather on interpretation of price data. One of the key tenets of technical analysis is that price patterns repeat themselves, allowing technical traders to make highly probabilistic bets on the direction of the instrument.
FX lends itself particularly well to technical analysis because it trades 24 hour per day and therefore provides a continuous stream of data that can be used for statistical analysis.
glossary from FX Words, and charts powered by FX Solutions Accucharts
