

USD/JPY Ahead of Non−Farm Payrolls
Basil Fayadh from eToro USA at 02/04/10
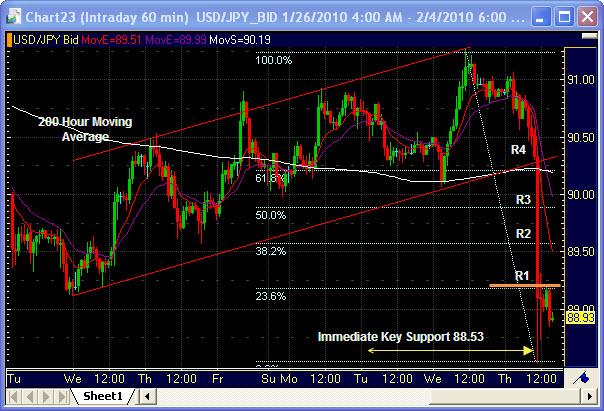
USD/JPY Technical Analysis Ahead of Non-Farm Payrolls and Unemployment
USD/JPY was offered today, after it came to light that many hedge funds and Asian accounts sold off their European government bond exposure. EUR/JPY sold off this morning with most saying that this added momentum to the big sell-off earlier today. Looks like stops were hit under .9000 which was just under a significant support area of the 200 hour Moving Average and trend-line support. It seems that many have taken a risk-off stance today which led JPY to strengthen as well. At this point in time, we are currently consolidating on the hourly chart after a low was made at 88.53 and is now seen as immediate key support, and the top of the consolidation (immediate resistance R1) seen around .8918 as a pennant continuation pattern is currently being made. Ahead of the Non –Farm Payroll numbers and Unemployment Rate Data (see below) that is coming out at 8:30 A.M. EST any USD strength pushing the pair above immediate resistance could yield to R2 (89.58), R3 (89.89) and R4 (around .9000/20) which could be seen as good resistance points to position for another ride down. Noticeably, these are also Fibonacci levels from the ride down from February 3rd at 11:00 am EST at .9216. On the downside immediate key resistance is seen at the low around .8853 with next support levels to be found on the daily chart around .8800 and .8738.
Remember after big news events there’s usually a knee-jerk reaction in the markets so be careful with your trading making sure to use stops and limits and see if you can time yourself on pullbacks and retracements for better entries. Even though news may come out clear cut better or worse than expected sometimes the markets may decipher them differently and it may react in an unpredictable fashion . Non-Farm Payrolls for January are expected to come in at 15K, with a previous number at -85K, and unemployment at 10%, with previous at 10% due out at 8:30 A.M. EST (see calendar)
Most analysts in the U.S. are still concentrating on the fact that the employment and housing market are still in a slump, and a sign of good times to come won’t be reflected until these numbers get better.
So as I usually finish, remember the 10 trading rules:
1. Never Let a Winner Turn Into a Loser
2. Logic Wins, Impulse Kills
3. Never Risk More Than 2% per Trade
4. Trigger Fundamentally, Enter and Exit Technically
5. Always Pair Strong With Weak
6. Being Right but Being Early Simply Means That You Are Wrong
7. Know the Difference Between Scaling In and Adding to a Loser
8. What is Mathematically Optimal Is Psychologically Impossible
9. Risk Can Be Predetermined, but Reward Is Unpredictable
10. No Excuses, Ever
Views in my postings are purely opinion and are not meant to be taken as trading advice.
Charts powered by FX Solutions Accucharts
Forex Glossary by FX Words
Pennant- In technical analysis, refers to a chart pattern occurring when the trading range formed by successive highs and lows narrows over time. Usually indicative of a continuation in the market.
Non-Farm Employment Change- Change in the number of employed people during the previous month, excluding the farming industry. Usually reased monthly, on the first Friday after the month ends
Resistance-
The price level in which a currency pair has difficulty trading above. At resistance, price action tends to stall before breaking above, or reverse in the opposite direction.
In technical analysis, key support/resistance levels are used as buy and sell signals when markets are ranging. Generally, the strength of support & resistance levels are measured by how many times the price reaches a specific level, but fails to break through. Also should a level have been tested a number of times previously, traders will often watch for a breakout to come.
Support-
A price level in which a currency pair has difficulty falling below. At support, price action tends to stall before breaking below, or reverse in the opposite direction.
In technical analysis, key support/resistance levels are used as buy and sell signals when markets are ranging. Generally, the strength of support & resistance levels are measured by how many times the price reaches a specific level, but fails to break through. Also should a level have been tested a number of times previously, traders will often watch for a breakout to come.
