

Beginning Traders' Corner
Basil Fayadh from eToro USA at 01/21/10
EUR/USD Making A Break!
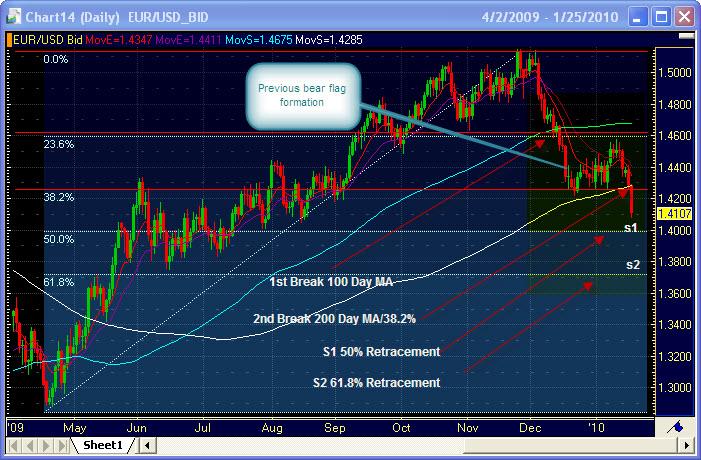
EUR/USD has broken it's Bear Flag formation that had been forming since it's break of the 100 Day Moving Average, around 1.4600/ 1.4620 on 12/15/09. Since then it has been trading in a range from roughly 14260 to 1.4577 until today, when it broke the 38.2% Fibonacci Retracement Level and 200 Day Moving Average at 1.4280. Right now the pair is currently trading around 1.4100. and Is targeting the 1.4000 (S2) level, which is incidentally the 50% Fibonacci Retracement Level, and on to around 1.3700/10 which is the 61.8% Fibonacci Retracement Level. (see earlier post)
The Fibonacci Retracement was marked from the low 4/22/09 at 1.2885 to the high at 1.5143 on 11/25/2009 with the retracement being the return of this movement. It is also worth noting that when a currency pair moves through any of these support levels, these levels usually become new points of resistance, which can, in turn be used as reference points for stop/limit orders.
Keep in mind, that round numbers in the currency market (referred to as The Figure) are areas of psychological support and resistance, usually with no key technical significance. Fundamentally today, the United States had the release of its Builiding Permits numbers which are the annualized number of new residential building permits issued during the previous month. It is the first time since the July, 2009 (6th previous release!) that it has been a positive number at 0.65 M, versus 0.59M expected. Remember that the economic releases need to be better or worse than expectations, and not only positive or negative to have an impact on the markets. Tomorrow, 1/21/10 we have unemployment claims at 8:30 a.m. expected at 441K, and then the Philly Fed Manufacturing Index at 10:30 a.m. which could kick the USD into high gear given the relative drive of the USD over the last few days. Also notable is the idea that there may have been large sell stop orders behind 1.4200 which when triggered may also have kicked the pair into overdrive on the downside. It will definitely be interesting to see if the momentum continues into the end of the week, or in fact stops and retraces back to previous support
1) Bear Flag: A technical analysis term referring to a chart pattern created when a
steep rise (or fall) is followed by trading in a narrow price range,
followed by a steep rise (or fall). Some technical analysts believe
that if a rise (or fall) precedes the “”flag”" then a rise (or fall) is
likely to follow it.
Fibonacci sequence, named for its discoverer Leonardo Fibonacci, forms
the basis for Elliott Wave theory used in trading financial markets.
Out of Elliott Wave theory comes Fibonacci retracements and Fibonacci
arcs discussed below. The Fibonacci sequence is
1,1,2,3,5,8,13,21,,34,55,89… to infinity. The sum of two consecutive
numbers equals the next number. The ratio of any number to its next
highest number approaches .618. The ratio of alternating numbers
approaches .382. Also, 1 - .618 = .382. The midpoint of .382 and .618
is .50. This is why .382, .50, and .618 are used. Retracements
In technical analysis, Fibonacci retracements
approximate support and resistance (and potential turning points)
following a trend. Calculate the distance from the low to the high of
the trend and calculate 38.2%, 50%, and 61.8% of the distance of the
trend. Subtract those values from the top of the trend. Those are the
potential reversal points. Charting packages perform the calculations
for you - all you have to do is connect the low of the trend with the
high of the trend using the Fibonacci retracement tool.
Charts powered by FX Solutions Accucharts
