

Chart of the Day – EUR/USD
James Chen from FX Solutions at 01/28/10
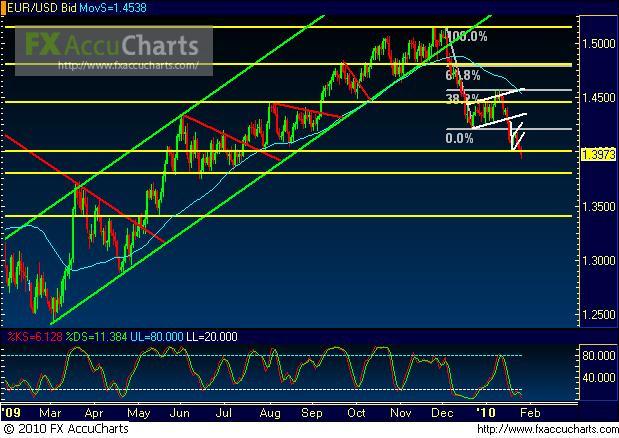
(Chart courtesy of FX Solutions' FX AccuCharts. Price on 1st pane, Slow Stochastics on 2nd pane; horizontal support/resistance levels in yellow; uptrend lines in green; downtrend lines in red; chart patterns in white; 50-period simple moving average in light blue.)
1/28/2010 – EUR/USD – Price action on EUR/USD, a daily chart of which is shown, has finally made a tentative breakdown below the 1.4000 support/resistance and psychological barrier, establishing a new 6-month low for the pair. This occurs after a slight bullish retracement that occurred several days ago which formed a small flag-like consolidation pattern. The current tentative bearish breakdown indicates a potential continuation in the new overall downtrend that began after the previous long-term uptrend was broken to the downside in early December. With further bearishness helped out by a daily close below 1.4000, the key downside support target currently resides in the 1.3800 price region. On a longer-term basis, continued bearishness that falls below 1.3800 could target key support in the 1.3400 price region. To the upside, in the event of any bullish pullback, the 1.4200 price region should provide strong resistance within the context of the current overall downtrend.
IMPORTANT NOTICE: These comments are for information purposes only. The information contained on this document does not constitute a solicitation to buy or sell by FX Solutions, LLC., and/or its affiliates, and is not to be available to individuals in a jurisdiction where such availability would be contrary to local regulation or law. Opinions, market data, and recommendations are subject to change at any time. Forex trading involves substantial risk of loss and is not suitable for all investors.
