

Chart of the Day – USD/JPY
James Chen from FX Solutions at 02/19/10
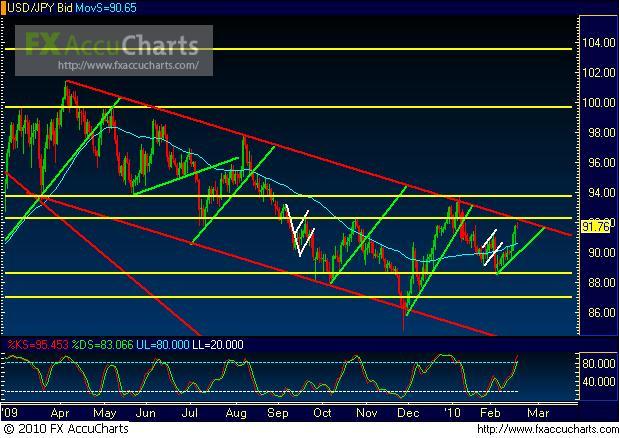
(Chart courtesy of FX Solutions' FX AccuCharts. Price on 1st pane, Slow Stochastics on 2nd pane; horizontal support/resistance levels in yellow; uptrend lines in green; downtrend lines in red; chart patterns in white; 50-period simple moving average in light blue.)
2/19/2010 – USD/JPY – Recent bullish price action on USD/JPY, a daily chart of which is shown, has risen to approach dynamic resistance around the top border of a parallel downtrend channel that has been in place since the April 2009 high. In the process, the pair has established a new 5-week high. In the event that the bullish momentum continues on to break out above the downtrend channel, which would jeopardize the current overall downtrend, a key resistance target to the upside resides around the 93.75 price region. This support/resistance level represents the year-to-date high, as well as the point at which price previously turned down on reaching the top of the downtrend channel. If the downtrend is currently respected again with a turn back down around the channel’s top border, one potential trigger to short would be a breakdown below the short-term uptrend support line extending from the recent 88.50 low. If this trendline breakdown occurs, a key initial support target to the downside resides in the 88.50 price region.
IMPORTANT NOTICE: These comments are for information purposes only. The information contained on this document does not constitute a solicitation to buy or sell by FX Solutions, LLC., and/or its affiliates, and is not to be available to individuals in a jurisdiction where such availability would be contrary to local regulation or law. Opinions, market data, and recommendations are subject to change at any time. Forex trading involves substantial risk of loss and is not suitable for all investors.
