

Chart of the Day – USD/JPY
James Chen from FX Solutions at 01/19/10
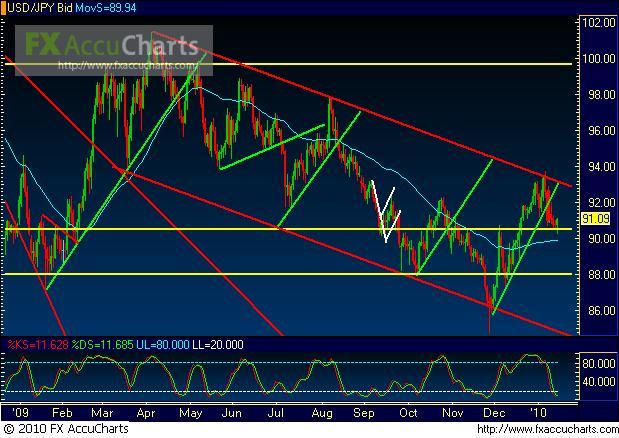
(Chart courtesy of FX Solutions' FX AccuCharts. Price on 1st pane, Slow Stochastics on 2nd pane; horizontal support/resistance levels in yellow; uptrend lines in green; downtrend lines in red; chart patterns in white; 50-period simple moving average in light blue.)
1/19/2010 – USD/JPY – Price action on USD/JPY, a daily chart of which is shown, has displayed marked bearishness for more than a week, since the top of a parallel downtrend channel was reached and respected in early January. In the course of this bearishness, price broke down below a key intra-channel uptrend support line extending from the late November lows. After that breakdown, price has continued to descend down to a key support region around the 90.50 area. Currently, the pair has made a tentative bounce up off this support region. Any subsequent breakdown below this support area could lead to further bearishness targeting support in the 88.00 price region. To the upside, the top border of the noted parallel downtrend channel should continue to serve as dynamic resistance in the event that price extends its current support bounce.
* Visit my forex tips and techniques blog here: http://fxpath.fxstreet.com *
IMPORTANT NOTICE: These comments are for information purposes only. The information contained on this document does not constitute a solicitation to buy or sell by FX Solutions, LLC., and/or its affiliates, and is not to be available to individuals in a jurisdiction where such availability would be contrary to local regulation or law. Opinions, market data, and recommendations are subject to change at any time. Forex trading involves substantial risk of loss and is not suitable for all investors.
