

Chart of the Day – Gold
James Chen from FX Solutions at 11/04/09
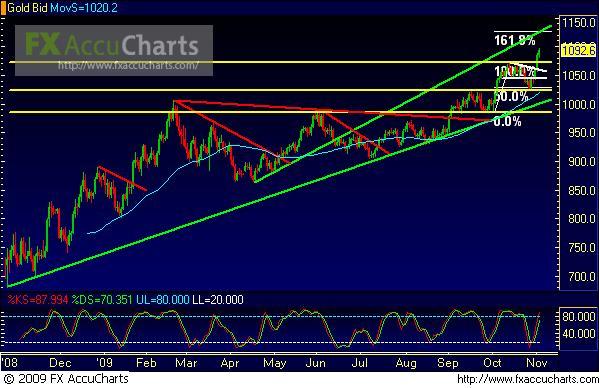
11/04/2009 – Gold – Late last week, price action on spot gold (a daily chart of which is shown) formed a bullish engulfing pattern right at strong support in the 1025 region, which represented previous resistance. After that bullish engulfing pattern established the new support level, which also coincided with a key 50% Fibonacci retracement level, price shot up this week to overtake the previous all-time high above 1070. Currently having just established a new all-time high above 1095, price on gold is now shooting for greater heights, potentially around the 161.8% Fibonacci extension of the most recent bullish run. As price is now in uncharted territory again, this key Fibonacci extension, which places the upside technical target around 1125, serves as further upside resistance. At this juncture, however, the potential for a bearish correction is significant. But with Indian demand for gold helping to prompt the recent bullish run, and potential Chinese demand possibly fueling a continuation, the overall directional bias continues to be bullish.
* Visit my forex tips and techniques blog here: http://fxpath.fxstreet.com *
IMPORTANT NOTICE: These comments are for information purposes only. The information contained on this document does not constitute a solicitation to buy or sell by FX Solutions, LLC., and/or its affiliates, and is not to be available to individuals in a jurisdiction where such availability would be contrary to local regulation or law. Opinions, market data, and recommendations are subject to change at any time. Forex trading involves substantial risk of loss and is not suitable for all investors.
