

Chart of the Day – USD/JPY
James Chen from FX Solutions at 12/17/09
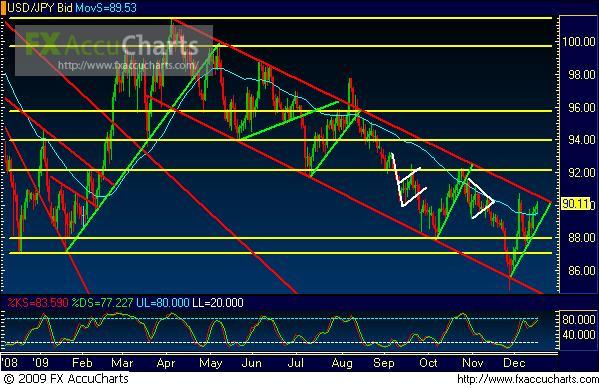
(Chart courtesy of FX Solutions' FX AccuCharts. Price on 1st pane, Slow Stochastics on 2nd pane; horizontal support/resistance levels in yellow; uptrend lines in green; downtrend lines in red; chart patterns in white; 50-period simple moving average in light blue.)
12/17/2009 – USD/JPY – Price action on USD/JPY, a daily chart of which is shown, has risen up once again to approach the top resistance border of a parallel downtrend channel that has been in effect since the April price high. In the course of the recent countertrend bullishness in the pair, price has formed a short-term, intra-channel uptrend that extends from the very bottom of the channel. In the event of an upside momentum exhaustion at or near the top of the noted parallel downtrend channel, a breakdown below this short-term uptrend line should confirm a continuation of the overall downtrend in the pair. In this case, key downside support levels within the channel reside around the 88.00 and 87.00 price regions. Any significant upside breakout above the parallel downtrend channel could indicate a potential trend reversal with an initial resistance target in the 92.00 price region.
* Visit my forex tips and techniques blog here: http://fxpath.fxstreet.com *
IMPORTANT NOTICE: These comments are for information purposes only. The information contained on this document does not constitute a solicitation to buy or sell by FX Solutions, LLC., and/or its affiliates, and is not to be available to individuals in a jurisdiction where such availability would be contrary to local regulation or law. Opinions, market data, and recommendations are subject to change at any time. Forex trading involves substantial risk of loss and is not suitable for all investors.
