

Chart of the Day – AUD/USD
James Chen from FX Solutions at 02/03/10
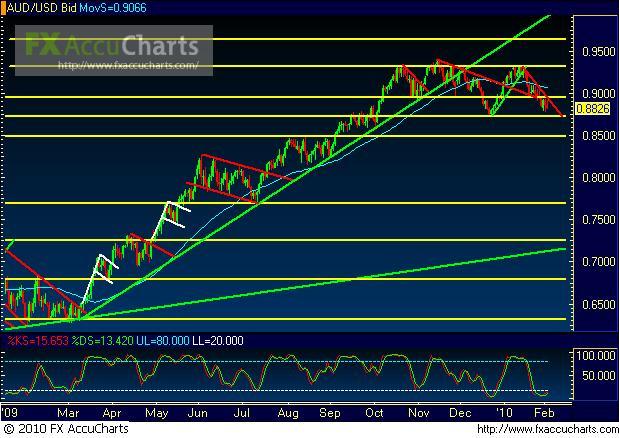
(Chart courtesy of FX Solutions' FX AccuCharts. Price on 1st pane, Slow Stochastics on 2nd pane; horizontal support/resistance levels in yellow; uptrend lines in green; downtrend lines in red; 50-period simple moving average in light blue.)
2/03/2010 – AUD/USD – Price action on AUD/USD, a daily chart of which is shown, continues to languish in a sideways consolidation, although the last couple of weeks have been decidedly bearish for the pair. After price reached strong resistance around 0.9325 in mid-January (just shy of the 15-month high around 0.9400 that was hit in mid-November 2009), the directional bias has been steeply bearish, forming a well-defined short-term downtrend resistance line. In the process of this bearishness, the pair has fallen below 0.8950 region support, and has approached further support in the 0.8730 price region, which was the level of the last major low hit in late December. With continued bearishness in the pair that breaks down below the 0.8730 price region, the current sideways consolidation will have been broken, with a possible new downtrend in the making. In this event, further key support to the downside resides in the 0.8500 price region. Upside resistance within the context of the current bearishness resides around the noted 0.8950 support/resistance price region.
IMPORTANT NOTICE: These comments are for information purposes only. The information contained on this document does not constitute a solicitation to buy or sell by FX Solutions, LLC., and/or its affiliates, and is not to be available to individuals in a jurisdiction where such availability would be contrary to local regulation or law. Opinions, market data, and recommendations are subject to change at any time. Forex trading involves substantial risk of loss and is not suitable for all investors.
