

Chart of the Day – AUD/USD
James Chen from FX Solutions at 12/18/09
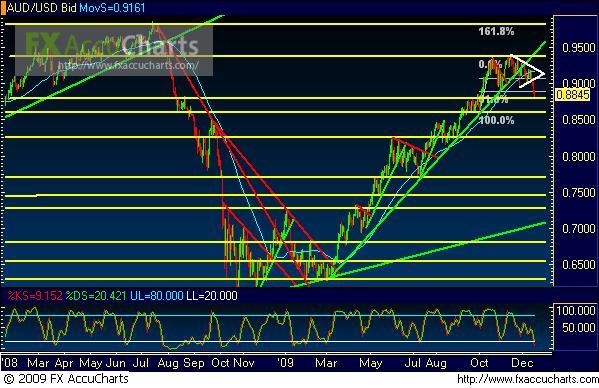
(Chart courtesy of FX Solutions' FX AccuCharts. Price on 1st pane, Slow Stochastics on 2nd pane; horizontal support/resistance levels in yellow; uptrend lines in green; downtrend lines in red; chart patterns in white; 50-period simple moving average in light blue.)
12/18/2009 – AUD/USD – Price action on AUD/USD, a daily chart of which is shown, has dropped to around the 0.8800 support level after having broken down below a significant triangle pattern consolidation. This occurs in the midst of a potential bearish reversal of the long-term uptrend that has been in place since the March lows. Displaying evidence of having developed a topping formation, this currency pair continues to have a bearish bias in line with recent U.S. dollar strengthening against all major currencies. In the event of further AUD/USD bearishness that drops below 0.8800, which would confirm a continuation of the trend reversal, price should target further downside support in the 0.8600 price region. Tentative upside resistance within the context of the current bearishness tentatively resides in the 0.8950 price region.
* Visit my forex tips and techniques blog here: http://fxpath.fxstreet.com *
IMPORTANT NOTICE: These comments are for information purposes only. The information contained on this document does not constitute a solicitation to buy or sell by FX Solutions, LLC., and/or its affiliates, and is not to be available to individuals in a jurisdiction where such availability would be contrary to local regulation or law. Opinions, market data, and recommendations are subject to change at any time. Forex trading involves substantial risk of loss and is not suitable for all investors.
