

Chart of the Day – EUR/USD
James Chen from FX Solutions at 02/02/10
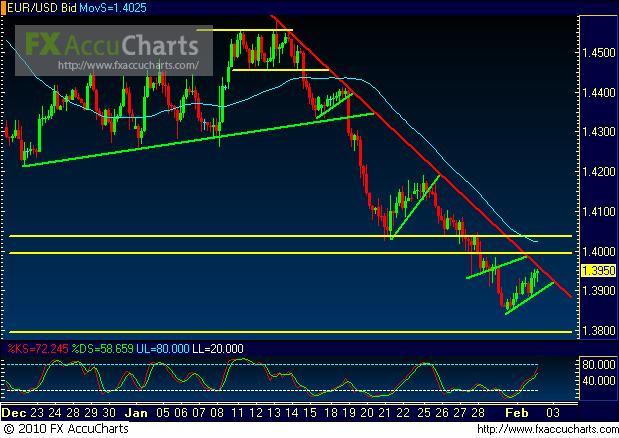
2/02/2010 – EUR/USD – Price action on EUR/USD, a 4-hour chart of which is shown, has made yet another bullish retracement within the context of the new overall downtrend. The current leg of this new downtrend extends from the January 13th high, and has formed a valid bearish resistance trendline. Within the context of this downtrend resistance line, price has made several breakdowns of both short-term uptrend support lines and horizontal support levels. As might be expected, these breakdowns have continued the dominant downtrend with significant downside follow-through. If the current leg of the prevailing downtrend is to continue, a key continuation trigger would be a breakdown below the current short-term uptrend support line. A significant breakdown of this nature could target further downside support in the 1.3800 price region. To the upside, within the context of the current overall downtrend, in the event of any significant breakout above the current downtrend resistance line, the key 1.4000 psychological price region should serve as an immediate resistance area.
IMPORTANT NOTICE: These comments are for information purposes only. The information contained on this document does not constitute a solicitation to buy or sell by FX Solutions, LLC., and/or its affiliates, and is not to be available to individuals in a jurisdiction where such availability would be contrary to local regulation or law. Opinions, market data, and recommendations are subject to change at any time. Forex trading involves substantial risk of loss and is not suitable for all investors.
