

Chart of the Day – EUR/USD
James Chen from FX Solutions at 02/12/10
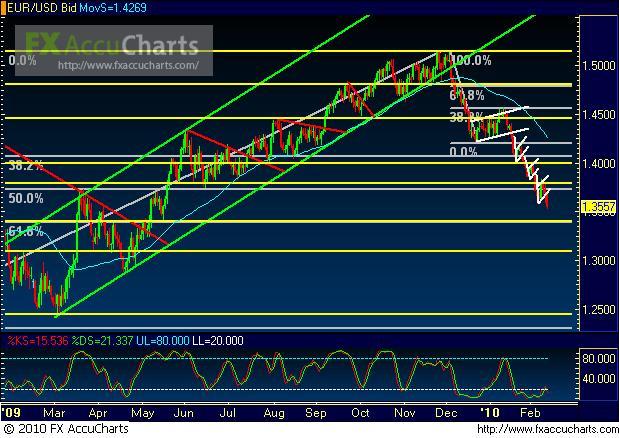
(Chart courtesy of FX Solutions' FX AccuCharts. Price on 1st pane, Slow Stochastics on 2nd pane; horizontal support/resistance levels in yellow; uptrend lines in green; downtrend lines in red; chart patterns in white; 50-period simple moving average in light blue.)
2/12/2010 – EUR/USD – Price action on EUR/USD, a daily chart of which is shown, has continued its steeply-angled bearish trend after making yet another bullish correction/consolidation earlier in the week. This minor bullish correction, in the rough form of yet another inverted flag pattern, was halted just above key resistance in the 1.3800 price region. The current bearish trend continuation has established yet another new 8-month low in the pair after having broken down below the low of the prior week. Currently, the directional bias continues to be bearish, with the pair targeting key downside support in the 1.3400 price region. Strongly bearish price action that breaks down below the 1.3400 region could, going forward, target further downside support in the 1.3100 price region. Upside resistance within the context of the current steep downtrend continues to reside around the noted 1.3800 support/resistance price region.
IMPORTANT NOTICE: These comments are for information purposes only. The information contained on this document does not constitute a solicitation to buy or sell by FX Solutions, LLC., and/or its affiliates, and is not to be available to individuals in a jurisdiction where such availability would be contrary to local regulation or law. Opinions, market data, and recommendations are subject to change at any time. Forex trading involves substantial risk of loss and is not suitable for all investors.
