

Chart of the Day – EUR/USD
James Chen from FX Solutions at 10/20/09
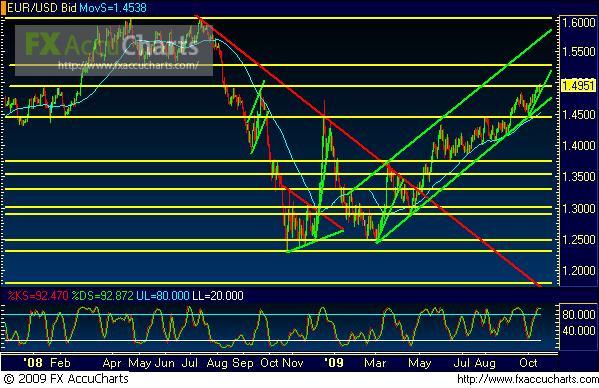
10/20/2009 – EUR/USD – Price action on EUR/USD, a daily chart of which is shown, has just reached a new 14-month high, and has stalled around yet another resistance level (just under the 1.5000 price region), within the context of a strong continuing uptrend. This uptrend is framed by a clear parallel uptrend channel that has been firmly in place since the March lows. The overall trend and directional bias continue to be bullish, although the short-term uptrend since the beginning of this month has been excessively steep. Therefore, a bearish correction may soon be in the making, with strong dynamic support residing around the bottom border of the parallel uptrend channel. Any strong breakout above 1.5000 would be a significant trend move that could potentially carry the momentum to target further key resistance around 1.5300, which represents the double-top trough that occurred in mid-2008. The all-time high just above 1.6000 represents an important longer-term target if the current uptrend continues its course.
* Visit my forex tips and techniques blog here: http://fxpath.fxstreet.com *
IMPORTANT NOTICE: These comments are for information purposes only. The information contained on this document does not constitute a solicitation to buy or sell by FX Solutions, LLC., and/or its affiliates, and is not to be available to individuals in a jurisdiction where such availability would be contrary to local regulation or law. Opinions, market data, and recommendations are subject to change at any time. Forex trading involves substantial risk of loss and is not suitable for all investors.
