

Chart of the Day – EUR/USD
James Chen from FX Solutions at 12/22/09
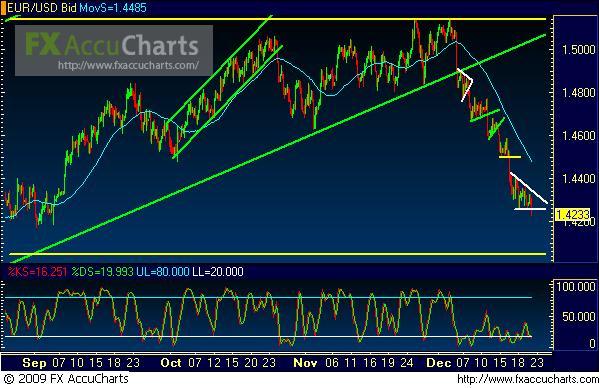
(Chart courtesy of FX Solutions' FX AccuCharts. Price on 1st pane, Slow Stochastics on 2nd pane; horizontal support/resistance levels in yellow; uptrend lines in green; downtrend lines in red; chart patterns in white; 50-period simple moving average in light blue.)
12/22/2009 – EUR/USD – Price action on EUR/USD, a 4-hour chart of which is shown, has consolidated once again within the context of a strong downside move. After the uptrend breakdown that occurred in the beginning of the month, this currency pair has been characterized by repeated consolidations and then breakdowns of those consolidations. The bearish bias in the pair continues to dominate as price continues to make lower highs and lower lows. Currently, price has just made a new 3-month low, with further bearishness likely. A strong breakdown and close below the 1.4250 price region should confirm a downtrend continuation out of the current descending triangle consolidation. In the event of this strong breakdown, a key further support target to the downside resides around the 1.4050 price region. Any breakout above the triangle, conversely, should meet strong resistance in the 1.4500 price region, which represents the bottom of the prior consolidation.
* Visit my forex tips and techniques blog here: http://fxpath.fxstreet.com *
IMPORTANT NOTICE: These comments are for information purposes only. The information contained on this document does not constitute a solicitation to buy or sell by FX Solutions, LLC., and/or its affiliates, and is not to be available to individuals in a jurisdiction where such availability would be contrary to local regulation or law. Opinions, market data, and recommendations are subject to change at any time. Forex trading involves substantial risk of loss and is not suitable for all investors.
