

Chart of the Day – GBP/USD
James Chen from FX Solutions at 02/18/10
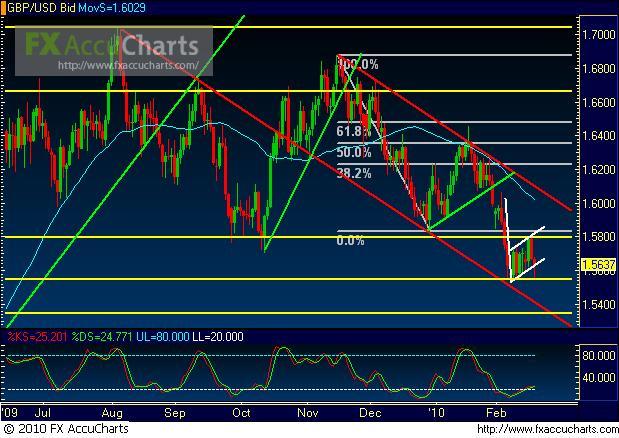
(Chart courtesy of FX Solutions' FX AccuCharts. Price on 1st pane, Slow Stochastics on 2nd pane; horizontal support/resistance levels in yellow; uptrend lines in green; downtrend lines in red; chart patterns in white; 50-period simple moving average in light blue.)
2/18/2010 – GBP/USD – Price action on GBP/USD, a daily chart of which is shown, has tentatively broken down below an inverted flag pattern consolidation within the context of an overall parallel downtrend channel that has been in place since the mid-November highs. This tentative flag break hints at continued potential bearishness in the pair in line with the prevailing downtrend. As of Thursday (2/18/2010), the low that was reached on the flag breakdown approached strong established support in the 1.5550 price region, which is the approximate low of the flag pattern, before bouncing back up again. Any subsequent breakdown below this 1.5550 flag pattern low could target further downside support in the 1.5350 price region and the bottom of the parallel downtrend channel. Significant upside resistance within the context of the current downtrend resides around the 1.5800 price region, which represents the top of the flag pattern consolidation area.
IMPORTANT NOTICE: These comments are for information purposes only. The information contained on this document does not constitute a solicitation to buy or sell by FX Solutions, LLC., and/or its affiliates, and is not to be available to individuals in a jurisdiction where such availability would be contrary to local regulation or law. Opinions, market data, and recommendations are subject to change at any time. Forex trading involves substantial risk of loss and is not suitable for all investors.
