

Chart of the Day – USD/JPY
James Chen from FX Solutions at 01/11/10
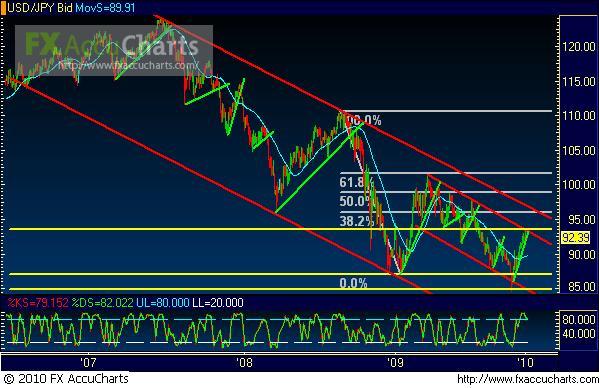
1/11/2010 – USD/JPY – After having hit a 4-month high at the top of a medium-term downtrend channel extending from the April 2009 high, price action on USD/JPY (a daily chart of which is shown) has respected that downtrend resistance by tentatively retreating. This medium-term downtrend channel resides within a larger, long-term downtrend channel extending from the June 2007 high. Currently, a key bearish event to watch for would be a significant breakdown below the steep intra-channel uptrend support line (of the smaller channel) that represents the recent bullish price action from the bottom to the top of the smaller channel. A strong breakdown below this steep uptrend line could mean a downside continuation of the medium-term downtrend. In the event that price rises to re-test and breakout above the medium-term downtrend channel, the pair could subsequently reach up to target further resistance around the 96.00 price region and the top border of the larger channel.
* Visit my forex tips and techniques blog here: http://fxpath.fxstreet.com *
IMPORTANT NOTICE: These comments are for information purposes only. The information contained on this document does not constitute a solicitation to buy or sell by FX Solutions, LLC., and/or its affiliates, and is not to be available to individuals in a jurisdiction where such availability would be contrary to local regulation or law. Opinions, market data, and recommendations are subject to change at any time. Forex trading involves substantial risk of loss and is not suitable for all investors.
