

Chart of the Day – USD/CAD
James Chen from FX Solutions at 12/10/09
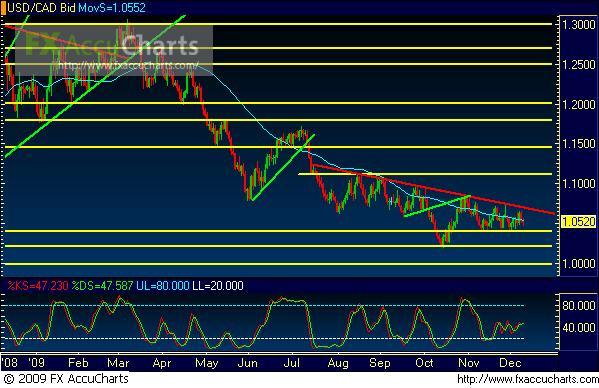
(Chart courtesy of FX Solutions' FX AccuCharts. Price on 1st pane, Slow Stochastics on 2nd pane; horizontal support/resistance levels in yellow; uptrend lines in green; downtrend lines in red; 50-period simple moving average in light blue.)
12/10/2009 – USD/CAD – Currently stuck in a short-term trading range consolidation, price action on USD/CAD (a daily chart of which is shown) is in the midst of a gently-sloped medium-term downtrend within the context of a long-term downtrend. The general directional bias on this currency pair continues to be bearish. Significant downside support resides around the key 1.0400 price level, the bottom of the current short-term trading range. Any breakdown below this level, in line with a continuation of downtrend bearishness, should target further support in the 1.0200 price region. This latter level represents the 14-month low for the pair that was last approached in mid-October. Dynamic upside resistance continues to reside around the medium-term downtrend resistance line that has been in effect since at least August.
* Visit my forex tips and techniques blog here: http://fxpath.fxstreet.com *
IMPORTANT NOTICE: These comments are for information purposes only. The information contained on this document does not constitute a solicitation to buy or sell by FX Solutions, LLC., and/or its affiliates, and is not to be available to individuals in a jurisdiction where such availability would be contrary to local regulation or law. Opinions, market data, and recommendations are subject to change at any time. Forex trading involves substantial risk of loss and is not suitable for all investors.
