

Chart of the Day – USD/CAD
James Chen from FX Solutions at 12/21/09
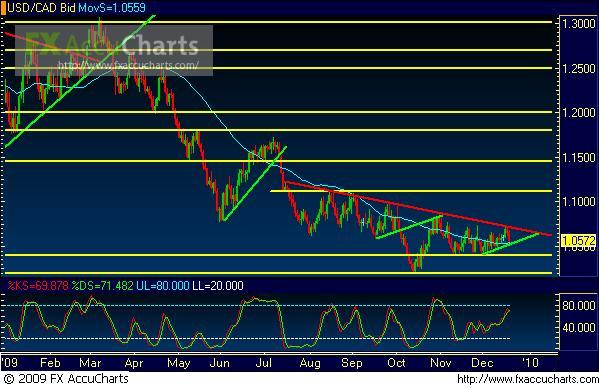
(Chart courtesy of FX Solutions' FX AccuCharts. Price on 1st pane, Slow Stochastics on 2nd pane; horizontal support/resistance levels in yellow; uptrend lines in green; downtrend lines in red; 50-period simple moving average in light blue.)
12/21/2009 – USD/CAD – Even with the substantial U.S. dollar-strengthening that occurred against several major currency pairs last week, the currently consolidating USD/CAD (a daily chart of which is shown) has still been unable to break out above a dynamic downtrend resistance line extending from August. This downtrend resistance line has been respected five times, with the most recent touch occurring late last week. Even with the strong dollar bullishness that has been evident recently in other currency pairs, USD/CAD did not make much upside progress, and then turned down right around the downtrend resistance line (in the 1.0745 price region). Key downside support within the current sideways consolidation resides in the 1.0400 support/resistance region. Any breakdown below this level should find further key support in the 1.0200 price region, which represents the 14-month low hit in mid-October. Dynamic upside resistance continues, for the time being, to reside around the noted downtrend resistance line.
* Visit my forex tips and techniques blog here: http://fxpath.fxstreet.com *
IMPORTANT NOTICE: These comments are for information purposes only. The information contained on this document does not constitute a solicitation to buy or sell by FX Solutions, LLC., and/or its affiliates, and is not to be available to individuals in a jurisdiction where such availability would be contrary to local regulation or law. Opinions, market data, and recommendations are subject to change at any time. Forex trading involves substantial risk of loss and is not suitable for all investors.
