

Currency Majors Technical Perspective
Ian G Coleman from FXstreet.com Independent Analyst Team at 01/20/10
EURUSD Current price: 1.4199
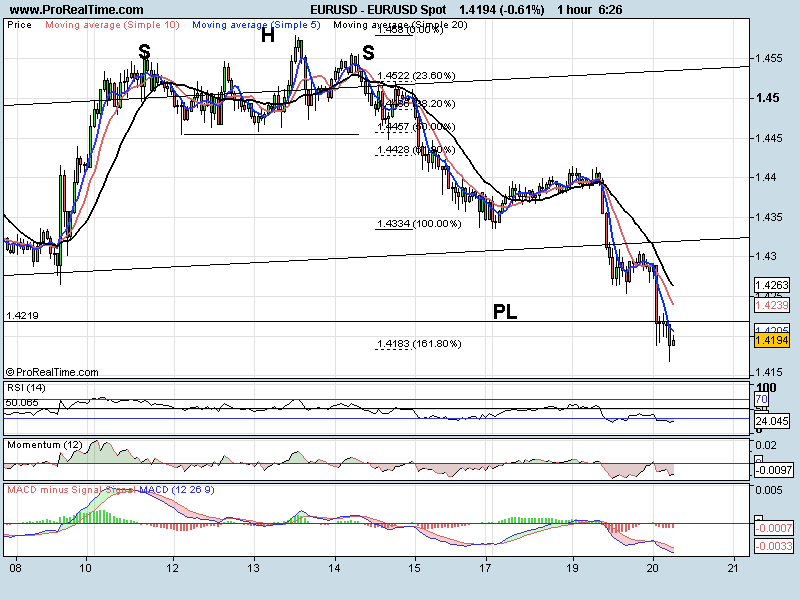
Asian stocks lower again overnight and the USD has strengthened. The EURUSD had a strong down day yesterday where we saw it break the expanding wedge formation and the previous low. 4 and 1 HR timeframes are looking exhausted and we may be forming a hammer on last 4 hr candle (too soon to tell). In my opinion, with the weekly Doji bar and the follow through we have had this week, any upward move should be short lived before the next move lower.
Support levels: 1.4183 1.4100 1.4054
Resistance levels: 1.4219 1.4263 1.4320
GBPUSD Current price: 1.6296
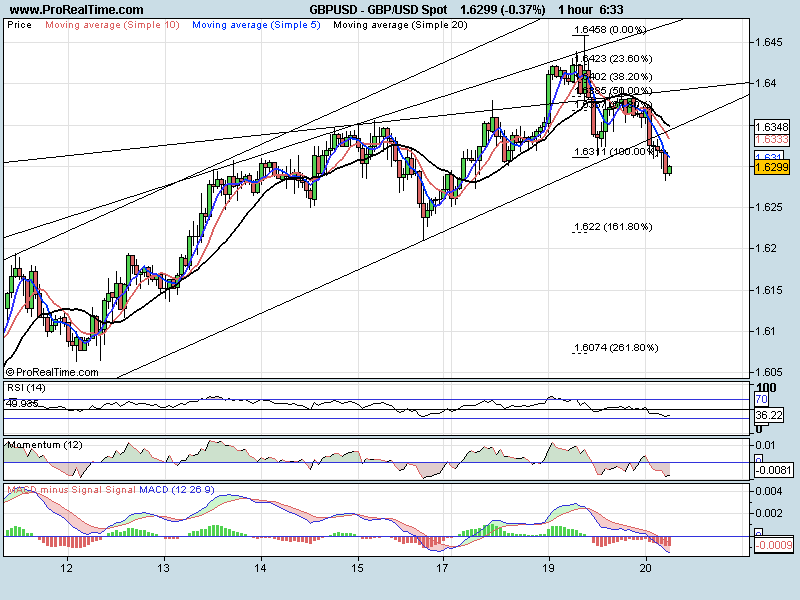
I think the daily bar says it all. A huge doji spiking through our trend line resistance at 1.6432,that we mentioned yesterday at the open. We also had strong divergence to sell (MACD) on our 4 hour chart at the high. Looking to the 1 hr chart we can see the move lower through what was resistance, now support, at 1.6382. We then move back up off the trend line to ‘test’ the break out level again. Now we are outside the channel and heading lower impulsively. All indicators are bearish and RSI is approaching its oversold level. The next significant low is at 1.6210 which lines up with the 161.8% target area (1.6220).Other USD pairs are, however, looking exhausted so we may pullback from here. A move through 1.6350 would negate the view.
Support levels: 1.6282 1.6251 1.6220
Resistance levels: 1.6311 1.6350 1.6391
USDJPY Current price: 91.23

Broke out of our wedge formation and headed higher. We have reached the first target level at 9132 but are now looking slightly exhausted as we lose upside momentum (we are still in the buy zone on the momentum indicator above zero). The 20 SMA is holding well at the moment (currently 91.12) and RSI is above 50 so at the moment we still have a bullish bias. A break lower may test 90.80 and the previous trend line now at 90.50. A continuation of the trend should see 92.00 as the target
Support levels: 91.06 90.80 90.50
Resistance levels: 91.36 91.64 92.00
USDCHF Current price: 1.0397
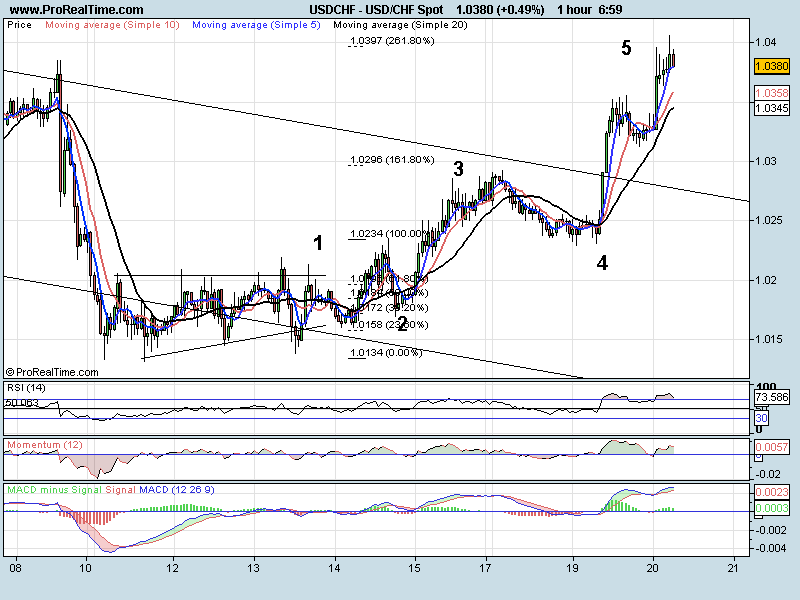
USDCHF moved higher from the open yesterday breaking the sideways-down (corrective) channel. This turned all indicators bullish and above their signals lines and sent the pair up and through the trend line. All Long Term chart look bullish but we are looking heavily overbought on 1 HR. We can also see a 261.8% target area at 1.0397 so we may correct lower from here. If we do move lower it should be choppy and in three waves and target the break out zone. This should only be corrective before the next leg higher.
Support levels: 1.0345 1.0312 1.0293
Resistance levels: 1.0406 1.0420 1.0510
Have a great day
