

Currency Majors Technical Perspective
Ian G Coleman from FXstreet.com Independent Analyst Team at 01/21/10
EURUSD Current price: 1.4111

The pair is little change overnight. Momentum is pulling back to the zero line and RSI is attempting to come out of the oversold area. 20 SMA is still holding the pair lower and currently stands at 1.4111. We do have a 38.2% retracement point (of the whole move up) at 1.4072 which we glanced overnight. We also have a previous low at 1.4051. I think any pullback would only be corrective before the next move lower and the previous low should act as some resistance (1.4219)
Support levels: 1.4072 1.4051 1.4000
Resistance levels: 1.4112 1.4136 1.4220
GBPUSD Current price: 1.6273
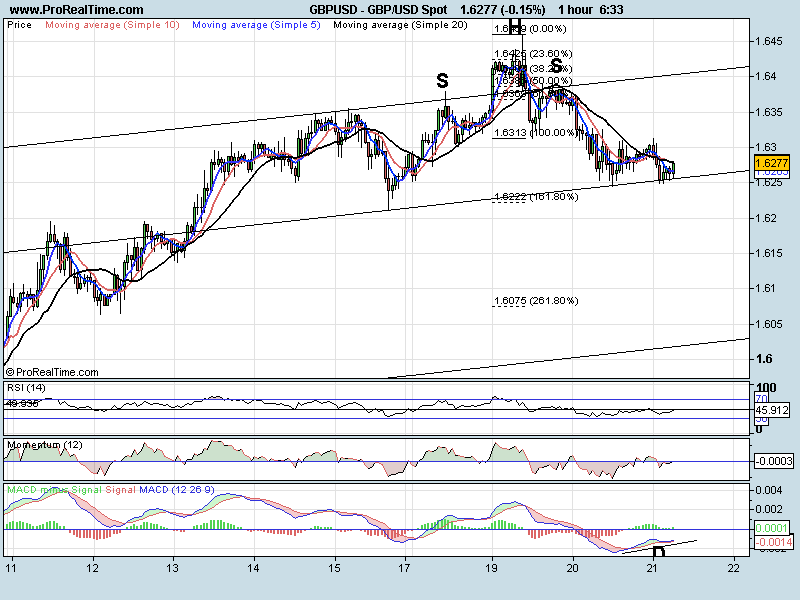
Still holding onto this upward channel at the moment (trend line at 1.6255). We have bounced off it overnight have some small divergence to buy on the MACD (D). If we can hold the trend line and break the previous high at 1.6313 it may open the way for a rally to the top of the channel at 1.6400. A break through 1.6245 would show this just as a corrective move sideways and we should open the way to the previous low at 1.6211 and possibly 1.6075.
Support levels: 1.6255 1.6245 1.6222
Resistance levels: 1.6313 1.6351 1.6377
USDJPY Current price: 91.53
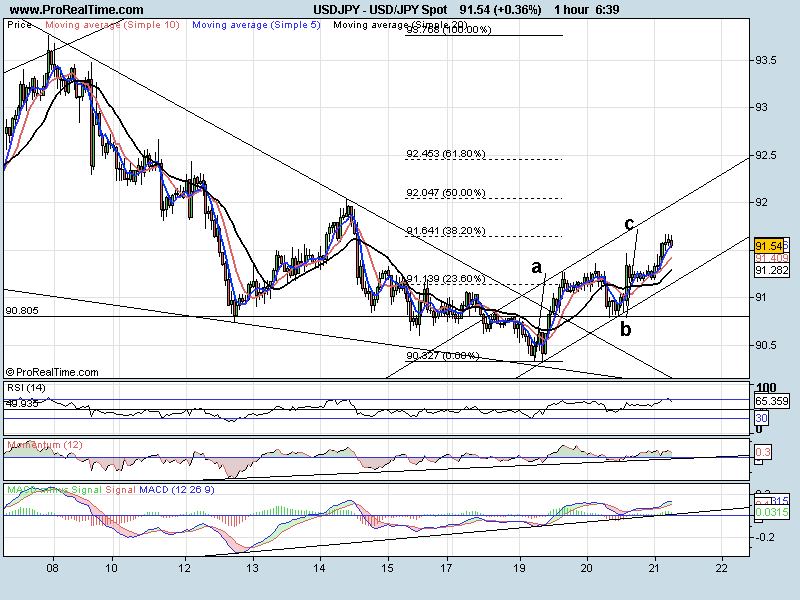
Staying in this corrective channel at the moment. We have just glanced the 38.2% retracement point at 91.64. This also lines up well with an ABC correction point at 91.72. We are still above the 20 SMA. All trend indicators are bullish but Momentum is starting to slow and head back down towards the zero line. I would watch this level for a possible move lower. A break above 91.72 and I would only expect 92.00 to signal the top. A break lower and 90.80 would be the first target followed by the low at 90.33
Support levels: 91.28 91.20 90.80
Resistance levels: 91.64 91.72 92.00 (strong)
USDCHF Current price: 1.0436
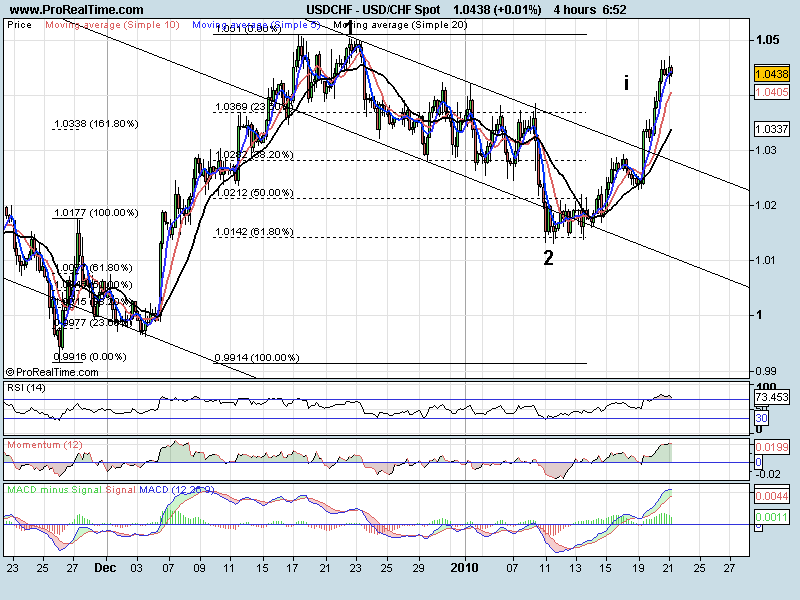
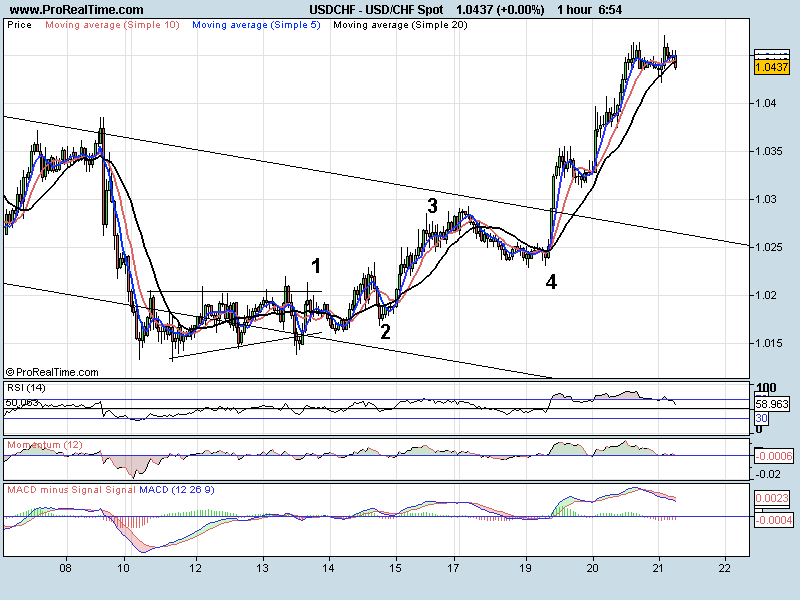
I am not saying this is how the pair is going to unfold but we do have a scenario here. The move up has been impulsive and aggressive which is typical of wave 3 in Elliott Wave. IF this is to be wave three then the large target would be 1.0876. That would mean that wave i (of wave three 3) would target 1.0420 before a small pullback. We are at 1.0440. We are looking heavily overbought on all timeframes and are pulling lower on the 1 hr chart. If we pullback it should only be short before the next leg higher.
Support levels: 1.0421 1.0400 1.0356
Resistance levels: 1.0464 1.0504 1.0556
Have a great day
