

Currency Majors Technical Perspective
Ian G Coleman from FXstreet.com Independent Analyst Team at 01/28/10
EURUSD Current price: 1.4011
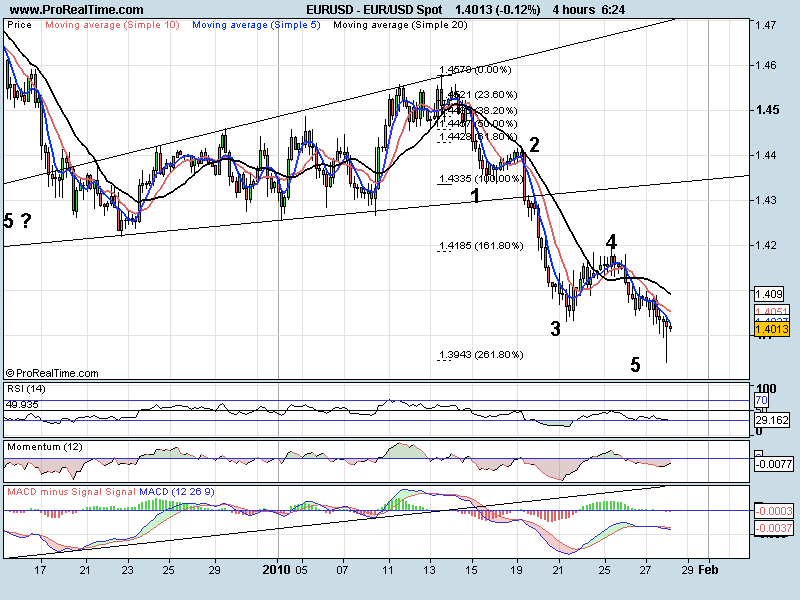
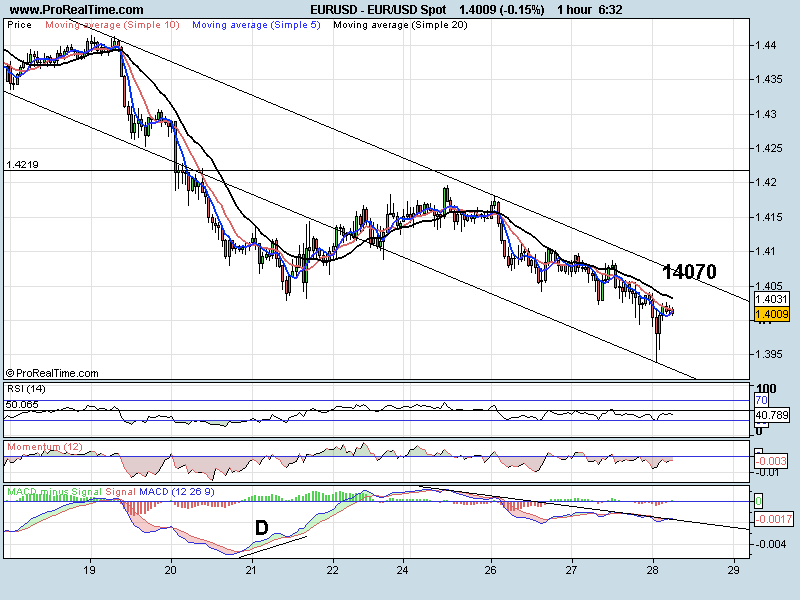
Fed unchanged overnight and EURUSD pushed lower on the news. If we look to the 4 hr chart we see a large doji for the last candle. This happened with a move down to 261.8% (13943) and made a low at 13938. We also have possible divergence to buy at this level with all indicators yet to make a lower low. (Nothing confirmed yet). If we then look to the 1 hr chart we are in a huge down channel with the upper trend line at 14070. All indicators are still in their sell zones but MACD is pushing on the trend line. IF we move higher I would look for a break of the 20 SMA first (1.4033) then a push through the trend line. A rejection and we could look to 13950 again.
Support levels: 1.4000 1.3950 1.3927
Resistance levels: 1.4033 1.4070 1.4180
GBPUSD Current price: 1.6198
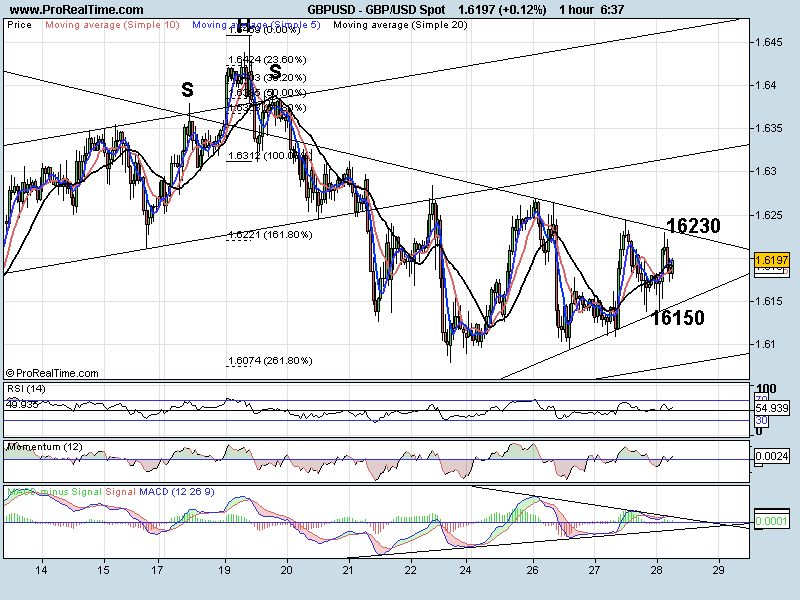
Very choppy last two days trading with GBPUSD making a triangle formation. It did hit 261.8% of the first wave and looked like it have completed its correction but the triangle has no bias which side we break out. Trend lines are 16230 and 16150. A break to the upside and 16315 should be the target and move lower and we should see the trend line at 16075 (note how all the oscillators are also making triangle which a slight upside bias with us being above zero)
Support levels: 1.6150 1.6100 1.6077
Resistance levels: 1.6230 1.6270 1.63121
USDJPY Current price: 9022

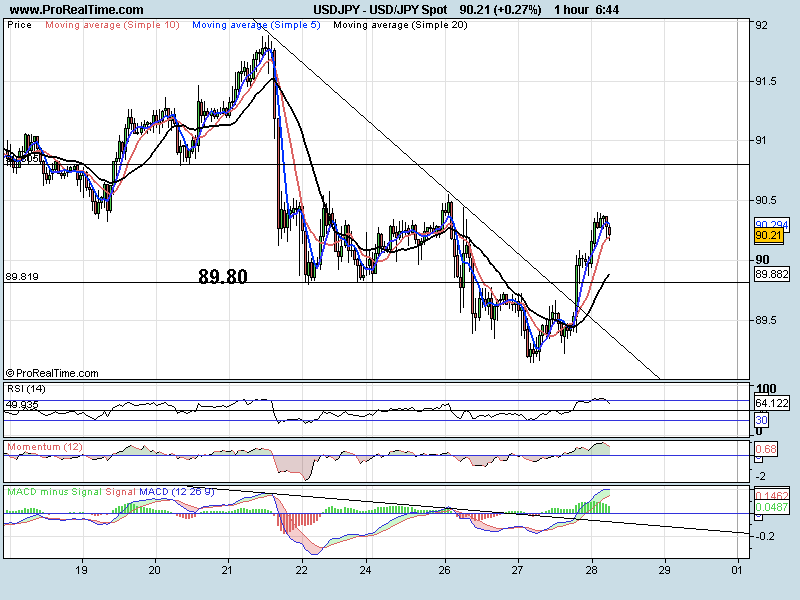
USDJPY hit the daily trend line (chart shown) and formed a hammer bottom candle. 1 hr chart and we broke the trend line at 8963 and pushed higher (note all oscillators broke at the same time). We have then made a rally for the previous high at 9056. RSI is now looking overbought so we may pullback slightly from here. After an impulsive move higher like that I think this will just be a correction (maybe to make a reverse Head and Shoulders) before potentially rallying to 9180. A move through 8980 and we should see 8920
Support levels: 9000 8980 8915
Resistance levels: 9041 9057 9080
USDCHF Current price: 1.0510

Pushed through the 1.5000 handle, but only to make a large doji on the 4 hour chart. We are still in an upward trend but indictors are starting to show some signs of correcting. The first signal would be to see a good red candle now. Then a break of the trend line (10460). As long as we stay inside this channel we may be seeing just a correction.
Support levels: 1.0500 1.0485 1.0460
Resistance levels: 1.0527 1.0554 1.0721
