

Currency Majors Technical Perspective
Ian G Coleman from FXstreet.com Independent Analyst Team at 02/05/10
EURUSD Current price: 1.3712
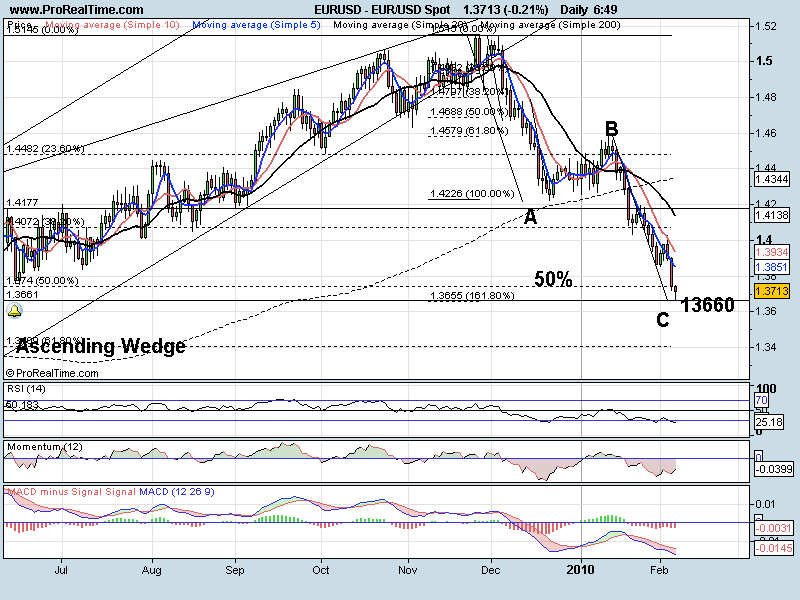
The Daily chart shows the move down and the very powerful down days yesterday. WE have now just clipped the target at 13660-65 area. This happens to be both an ABC sequence (which is corrective) and 161.*% of wave 1. How we correct from here (if we correct from here) will be essential. A slow drawn out correction to the between 13882 and 14016 (23.6% + 38.2%) and this may just be a pause before the next leg lower towards 1.2732.
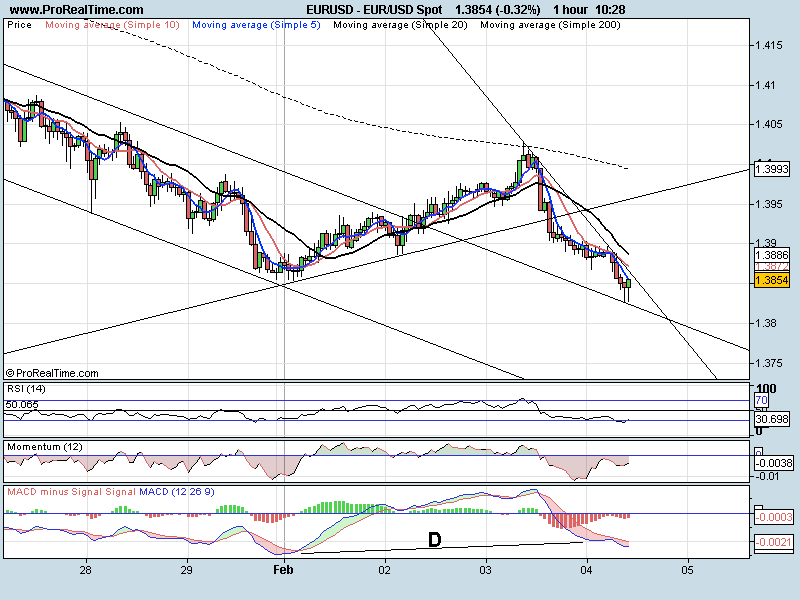
1 Hr chart just showing signs of a possible reversal. MACD has crossed / RSI is trying to break out and momentum is moving back towards zero.
Support levels: 1.3660 13600 1.3420
Resistance levels: 1.3752 1.3780 1.3850
GBPUSD Current price: 1.5714
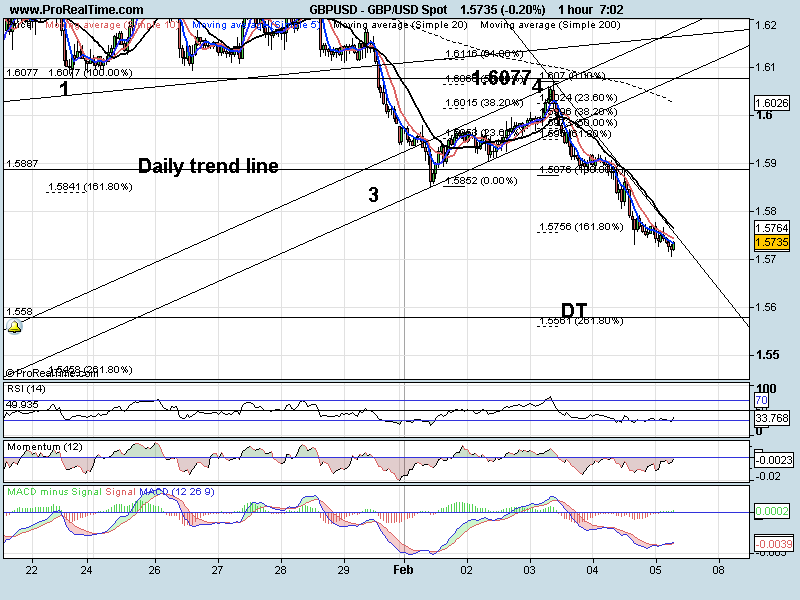
Still moving in a sharp descending channel. We have PPI out today at 9.30 GMT. Showing no real signs of a reversal yet. We do have a daily descending trend line at 1.5580 (DT). This would also line up with 261.8% of the first sub-wave.
Support levels: 1.5700 1.5650 1.5580
Resistance levels: 1.5756 1.5852 1.5923
USDJPY Current price: 89.68
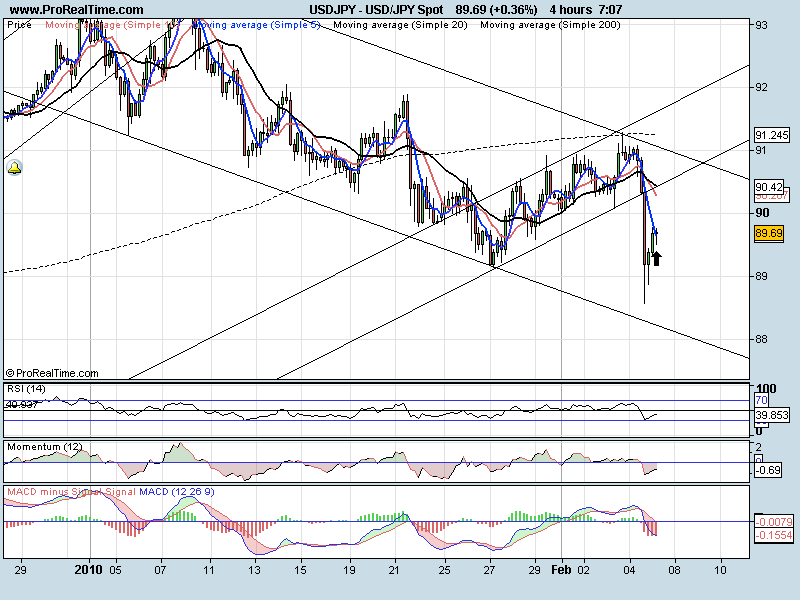
We spoke yesterday about the channel resistance at 91.20. We reached towards the top of the channel and fell off very steeply. Note that we hit the 200 SMA and this acted as a ceiling. We now look to be correcting higher. Daily trend line supported the pair at 89.00. With NFP out today this pair could literally go anywhere. A move lower and we have 88.00 as support. Higher and would need to see a channel break at 91.02
Support levels: 89.17 88.50 88.00
Resistance levels: 90.00 90.51 91.03
USDCHF Current price: 1.0718
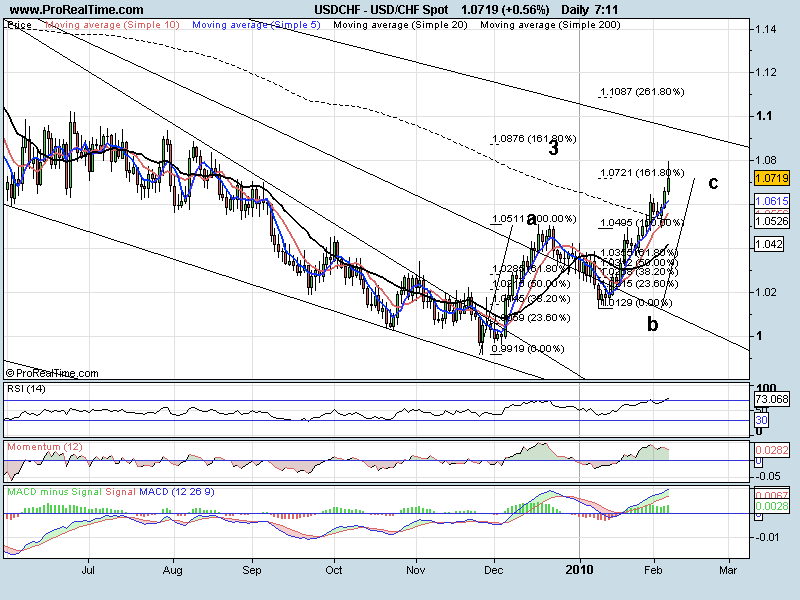
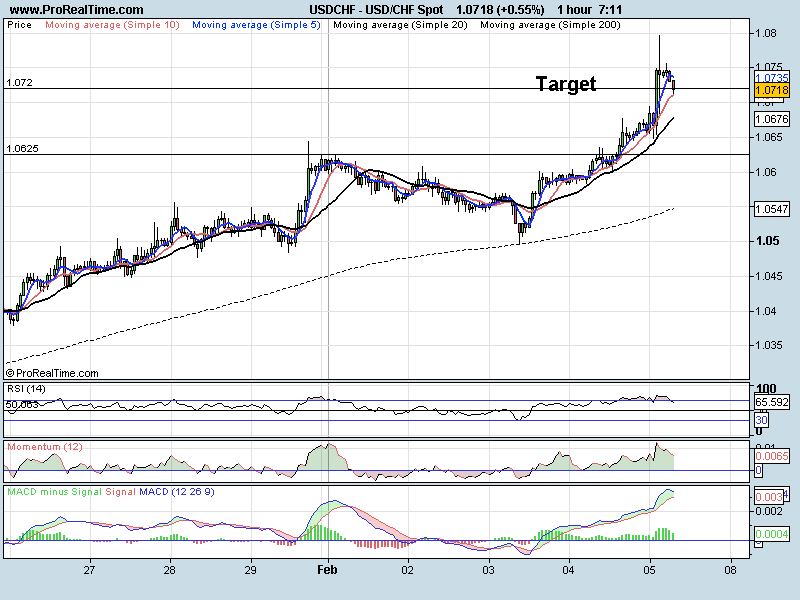
Met the target are at 1.0721 overnight, and as we see on the daily chart, we are spiking at the moment. A move lower from here and the whole move up will have been corrective. A move up to 1.0876 and we will be forming a third wave with the next big move up to 1.1500. 1 hr chart we can see the large spike followed by a two large red. This gives us a short term bearish bias
Support levels: 1.0721 1.0677 1.0625
Resistance levels: 1.0747 1.0800 1.0876
Have a great day
