

Currency Majors Technical Perspective
Valeria Bednarik from FXstreet.com Independent Analyst Team at 11/19/09
EUR/USD Current price: 1.4960
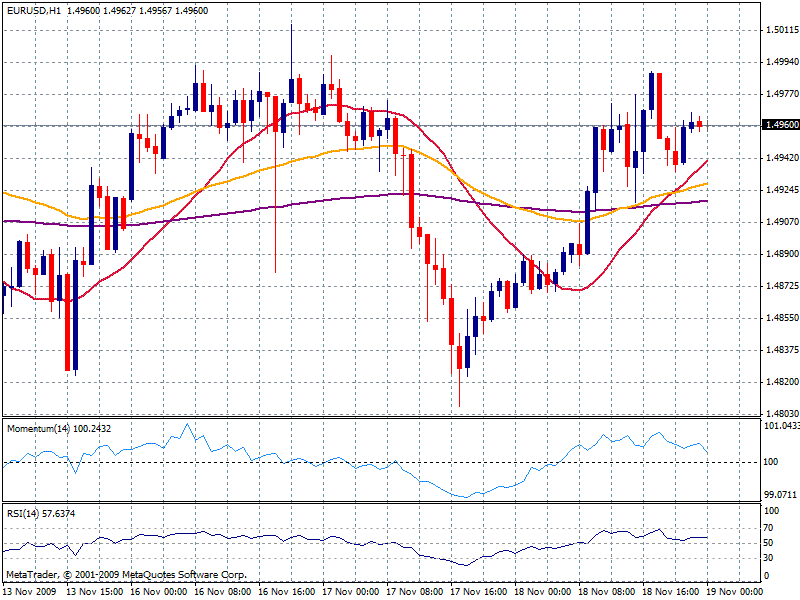
Pair remains consolidating around the 1.4960 level since U.S. close, after failing to break above the 1.5000 area again; with hourly indicators slightly bearish, and with bigger time frames flat, pair needs to move under 200 EMA (violet) around 1.4920 to extend current downside momentum. To the upside, 1.5000/20 level seems to be key as the pair has halted just under that zone since past Thursday: clear movements above that level will support a retest of the yearly high around 1.5060, ahead of 1.5100 area.
Support levels: 1.4920 1.4880 1.4840
Resistance levels: 1.4990 1.5020 1.5060
GBP/USD Current price: 1.6739

Breaking lower, pair finally detached from the 1.6800/40 area, and fall to 1.6710, first support to consider during next hours. Under 20 SMA and with bearish indicators in the hourly, an acceleration under that level should send the pair to retest the strong congestion zone between 1.6640/60. Bigger time frames indicators also support the bias.
Support levels: 1.6710 1.6650 1.6610
Resistance levels: 1.6800 1.6840 1.6880
USD/JPY Current price: 89.38
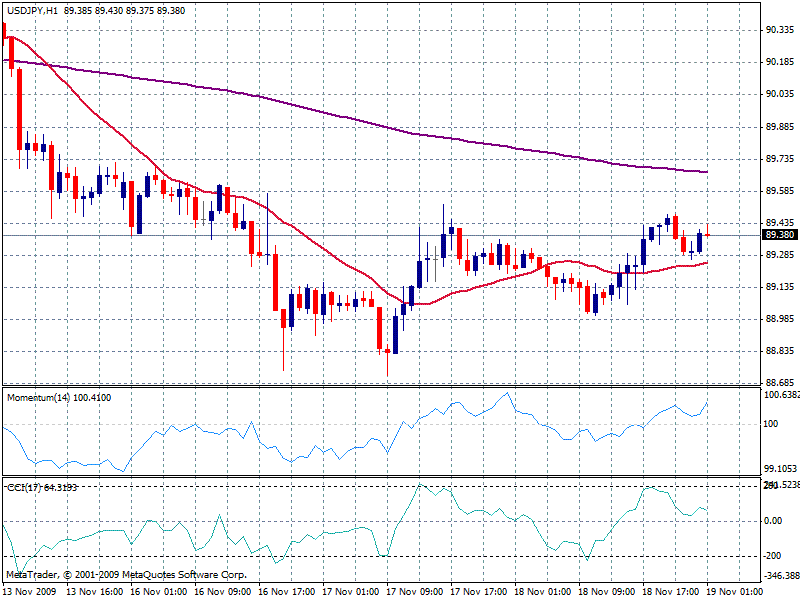
Also ranging, pair is slightly bullish at this point, supported by Nikkei 225 positive opening, still with no clear definitions in the hourly chart, as pair behavior remains quite choppy. Slightly bullish, yet far from confirming such movements, pair needs to overcome the 89.70 resistance level to move further up, with 90.10 as next resistance level to consider. Rebound from there will put the pair back under pressure, as only a clear daily close above 90.80 is needed to confirm further rises.
Support levels: 89.05 88.80 88.20
Resistance levels: 89.40 89.70 90.00
USD/CHF Current price: 1.0103
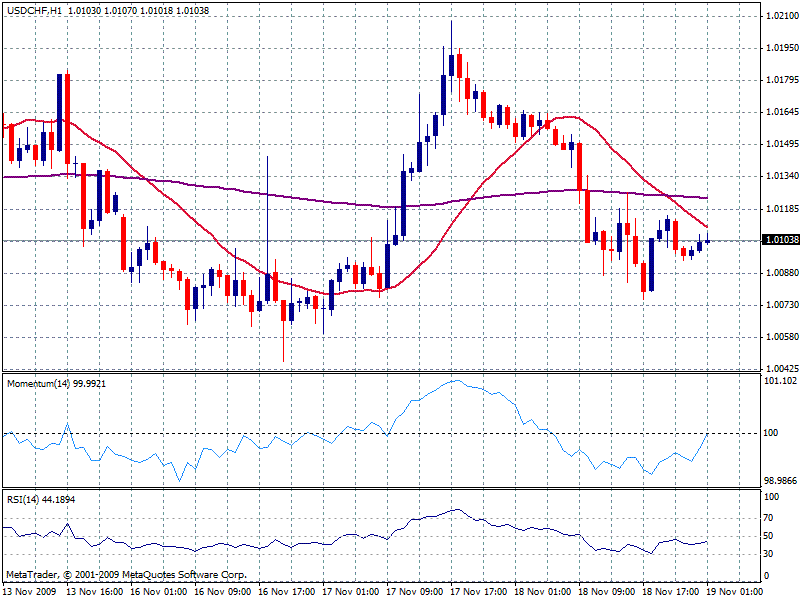
Also in range, hourly indicators turned slightly bullish yet 20 SMA above current price with a strong bearish slope, should gave the pair some hard time to extend the rally. Bigger time frames indicators are flat, giving no clear cues for next hours, as a break either above 1.0200 or under 1.0030, is needed.
Support levels: 1.1000 1.0060 1.0030
Resistance levels: 1.0130 1.0165 1.0200
