

EURUSD, GBPUSD & USDJPY Support & Resistance Analysis
RANsquawk Research Team from RANsquawk at 02/01/10
Pivotfarm.com is a provider of Technical Analysis data sheets for traders of various markets. Our data considers some of the most widely followed methodologies including Market Profile, Fibonacci, Volume Analysis, Calculated Pivots and most importantly price based Support and Resistance (S&R). We have combined all these methodologies in a confluence matrix. This allows the trader to determine the strength and importance of an S&R level; based upon the levels other market participants using differing calculation methods (Market Profile, Fibonacci etc) are watching. The Trading sheets are updated daily, many hours before the open of the trading session.

GBPUSD
USDJPY
 Glossary/User Info
Using this Information
The black strip of price based PowerZones are the key data described in these data sheets, they are based upon analysis of swing lows across multiple time frames and volume based analysis.
The sheet is structured around a central ‘PowerZones Confluence Matrix’ encircled by multiple peripheral data tables which feed into the central table. The peripheral tables help traders to add probability to potential price based PowerZones. Importantly all peripheral data sources such as Fibonacci Clusters, Volume Extremes etc, can be used completely independently of the main table. The information in this sheet is to be used solely as a guide, varying market conditions, news and volatility must be gauged by the individual trader.
IB – Initial Balance
The ‘Initial Balance’ is commonly used in Market Profile and simply describes the high and low of the first hour of trading. The data described is from the previous trading day.
TPO/Vol. Value Areas
The ‘TPO/Vol. Value Areas’ data is derived from Market Profile; the data described is created from the profile of the previous day’s price action. It defines the value area i.e. the area in which price spent 70% of its Time (TPO) OR Volume, the high of this 70% range being the VAH and the low being the VAL. Importantly the POC as described, is the price point that was most heavily traded and offers a key point of reference for trading. Described in the sheets are 1day, 5day and 20day Volume/TPO Value areas.
VAH – Value Area High
POC – Point of Control
VAL – Value Area Low
Naked VPOCs
The ‘Naked VPOCs’ is data created from the Volume based POC (Point of Control) of previous trading days; it is related to the ‘Volume Extremes’ data, in that it is volume extreme based, however it is based upon individual trading days, rather than cumulative volume data. The POC is the price at which the highest amount of volume was traded that day, Naked POCs are POCs that price hasn’t retested since their formation, thus offering an increased possibility of being ‘filled’ in future price movements.
Open Gaps
The ‘Open Gaps’ data describes the disparity that sometimes occurs between the previous day session close and the following day session open. In most instances this gap is “filled”, any gaps that remain unfilled have a tendency to be a magnet for price action in future. (*) Cash Market
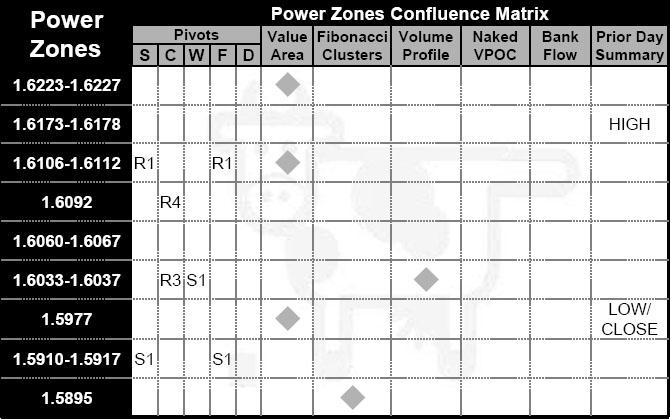
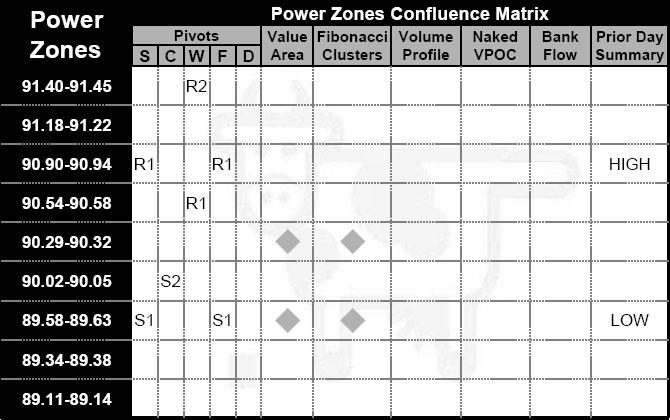
PowerZones Confluence Matrix
The ‘PowerZones Confluences Matrix’ is the single most important element of the Pivotfarm data sheet, the levels described on the left hand side of the table are defined by price and offer high probability areas for price reversal. The rest of the information is derived from the peripheral tables that surround the central table. They offer confirmation and confluence of the PowerZones levels and help users to determine when other market participants using that particular piece of information may be entering the market.
Pivot Points
The ‘Pivot Points’ data is widely used with various calculation methods, including Camarilla, Woodie and DeMark. These are calculations based upon the open, high, low and close of the previous day and provide mathematically derived Support/Resistance levels.
Prior Day Summary
The ‘Prior Day Summary’ data very simply describes the Open, High, Low, Close and Range of the previous trading session and also the range of the trading day.
Key News Events
The ‘Key News Events’ table describes scheduled market events that are likely to effect the trading session, not all scheduled events are included, only events that are key and likely to have an effect are included
iMap
The ‘iMap’ describes the directional bias of a set of indicators based on the daily chart. Red denotes Sell side bias, Blue a Neutral side bias and Green a Buy side bias.
Fibonacci Clusters
The ‘Fibonacci Clusters’ data is derived from Fibonacci retracement levels across multiple higher level timeframes (4hr and above), the information from these timeframes is then combined and areas that have multiple Fibonacci levels ‘clustering’ together are described in the table.
VWAP
The ‘VWAP’ data describes the ratio of the value traded to the total volume traded over a particular time horizon (usually one day). It is a measure of the average price an instrument traded at over that timescale. The sheets describe the VWAP at close of trading.
Daily Moving Averages
The ‘Daily Moving Averages’ data describes the relative positions of the 10, 20, 50, 100 and 200 day simple and exponential moving averages. These daily MAs are amongst the most widely watched in the market and based upon 24hr data.
Volume Extremes
The ‘Volume Extremes’ data is based upon long-term cumulative volume against price, the most noticeable volume peaks and valleys ar e described in the table. These are areas that are highly likely to be Support/Resistance as price is often drawn to these levels due to the extreme amounts of volume traded there over time.
