

The USD−Index fell for a second day to a low of 76.92
Varengold Bank Research Team from Varengold Wertpapierhandelsbank AG at 01/11/10
Good morning from cold and snowy Hamburg and welcome to our Daily Comment. Today, we will focus on the AUD and CAD. The currencies rose to record highs on commodity appreciation. Anywise, we wish you a nice start in the new week.
The biggest monthly gain in the USD-Index since January implies that we can expect continued gains for the AUD and the CAD as a result of the recovering U.S. economy boosting demand for their commodities. Accelerating U.S. growth will increase demand for Canadian oil and natural gas as China’s expansion boosts purchases of Australian iron ore and coal, economists expect. The AUD/USD climbed for a second day, starting the week with a gap and a record high of 0.9318, which is the highest level since the middle of March 2009. The USD/CAD fell to its lowest point since August 2008 hitting 1.0253.
The EUR/USD gained for the second day reaching 1.4533 after a Federal Reserve official signaled that interest rates may remain low for some time and a Chinese government report yesterday showed exports climbed for the first time in 14 months and imports reached record highs. The USD-Index fell for a second day to a low of 76.92. The Index has been gained almost 4 percent this month.
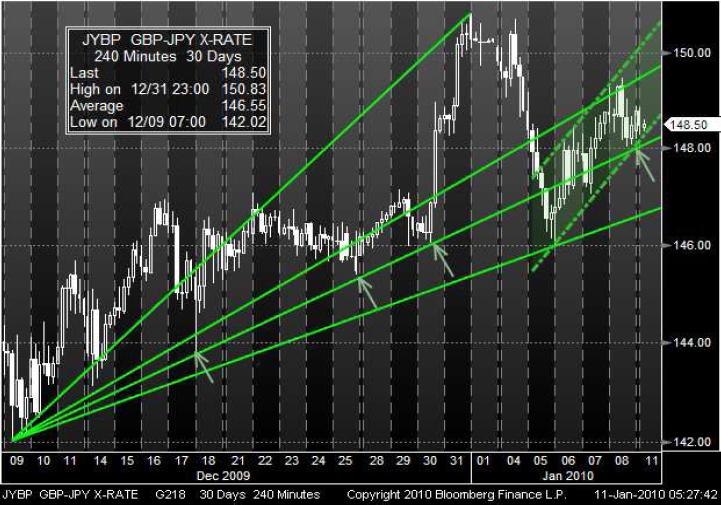
As you can see the GBP/JPY has been trading along a bullish Fibonacci fan. After it touched the upper line of the fan and the top of the short-term trend channel, the market pulled back and reached the middle line of the fan for the fifth time. During the past four touches, there were three pull-backs to the upside. The market also received support from the lower line of the short-term channel. This may be a sign for a repeated rebound.

Since the 18th of December, the CHF/JPY has been moving in a gaining phase along a bullish pitchfork. Since the 05th of January the market is gaining close under the middle line of the fork. As you can see, the RSI indicator is signalizing an overbought market. This should be a sign for a shortterm recovery. But on a middle-term view we expect that the market may continues gains inside the pitchfork.
